
Predicting subcellular localization of multisite proteins using differently weighted multi-label k-nearest neighbors sets
Abstract
BACKGROUND:
For a protein to execute its function, ensuring its correct subcellular localization is essential. In addition to biological experiments, bioinformatics is widely used to predict and determine the subcellular localization of proteins. However, single-feature extraction methods cannot effectively handle the huge amount of data and multisite localization of proteins. Thus, we developed a pseudo amino acid composition (PseAAC) method and an entropy density technique to extract feature fusion information from subcellular multisite proteins.
OBJECTIVE:
Predicting multiplex protein subcellular localization and achieve high prediction accuracy.
METHOD:
To improve the efficiency of predicting multiplex protein subcellular localization, we used the multi-label k-nearest neighbors algorithm and assigned different weights to various attributes. The method was evaluated using several performance metrics with a dataset consisting of protein sequences with single-site and multisite subcellular localizations.
RESULTS:
Evaluation experiments showed that the proposed method significantly improves the optimal overall accuracy rate of multiplex protein subcellular localization.
CONCLUSION:
This method can help to more comprehensively predict protein subcellular localization toward better understanding protein function, thereby bridging the gap between theory and application toward improved identification and monitoring of drug targets.
1.Introduction
Proteins are more complex and diverse than the DNA sequence that generates them. As protein subcellular localization (PSL) is highly correlated with protein function, effective PSL prediction methods provide information for understanding protein functions that is essential for several research applications such as in molecular biology [1, 2], cell biology [3, 4], and neuroscience [5], as well as in clinical medicine [6, 7, 8]. The prediction and recognition of PSL using bioinformatics methods is one of the fundamental objectives of proteomics and cell biology [9], as PSL information is crucial for discovering protein functions toward helping to understand the complex cellular pathways involved in the process of biological regulation.
In recent decades, high-throughput molecular biology technologies have brought about exponential growth in the number of protein sequences identified. Considering the vast amount of molecular data now available and continuously accumulating, it is vital to develop a fast and available method for identifying the subcellular locations of their sequence information [10, 11, 12, 13]. The basic requirement for a cell to function normally is that the proteins operate in specific subcellular positions [14]. The main limitations of current methods of predicting PSL is that they cannot handle information on multiple proteins simultaneously. Thus, new prediction methods must be able to predict both single- and multiple-point PSLs.
Since a given feature extraction method and dataset will yield different results depending on the prediction algorithm applied, we here propose a new method for extracting protein subcellular information using a feature fusion technique. Feature extraction methods including the entropy density and pseudo amino acid composition (PseAAC) are typically used for protein coding. Considering these two feature extraction methods, we used the multi-label k-nearest neighbors (ML-KNN) algorithm and assigned diverse weights to various attributes for predicting multiplex PSL. We then evaluated the developed algorithms using a variety of well-established performance indexes.
2.Materials and method
2.1Dataset
The dataset
2.2Feature extraction
2.2.1Entropy density
The entropy density was first introduced to represent DNA sequences and determine exons existing in gene sequences [15]. The Shannon entropy [16] is expressed as:
(1)
where
(2)
The sequence of protein
(3)
Where
2.2.2PseAAC
PseAAC was first developed to prevent the loss of hidden information in protein sequences and to provide a better expression of the initial information about AACs [17, 18, 19]. PseAAC reflects a protein expressed by generating 20
Suppose the protein molecule is represented by:
(4)
where
(5)
(6)
where
(7)
In the classic 20-dimensional AAC, the sequence order-correlated factors in Eq. (5) are added to produce a PseAAC containing (20
(8)
(9)
where
2.3Algorithm
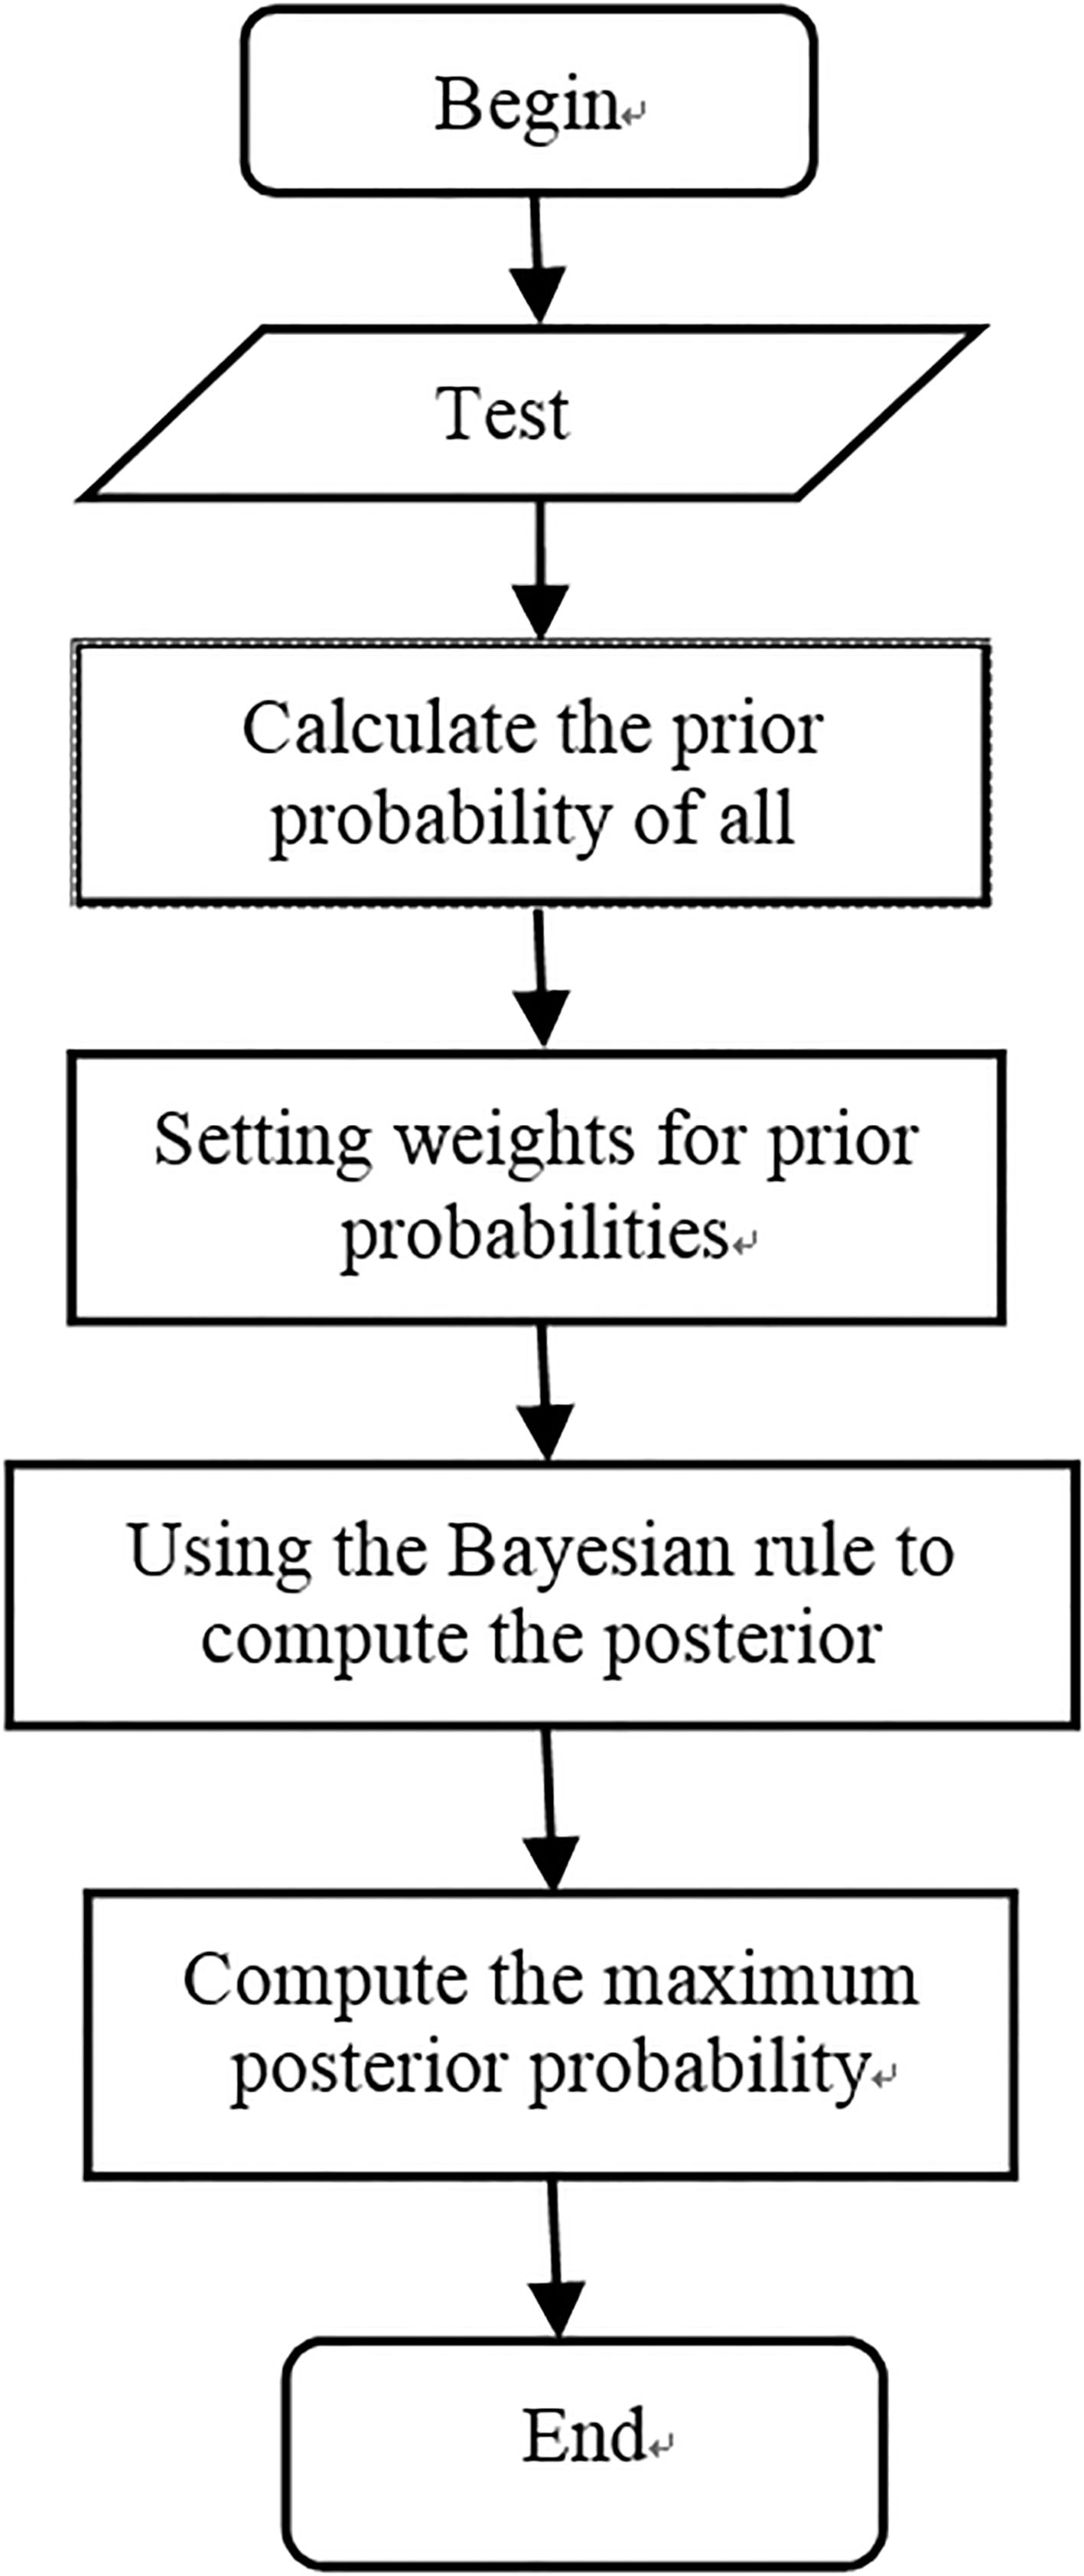
To guarantee the accuracy of PSL, a machine-learning algorithm must first be carefully designed. Although there are many algorithms available for predicting PSL, most of these focus only on a single subcellular location of a protein sequence, and cannot handle proteins located at multiple sites. With the increase in the discovery of multisite proteins, it is vital to obtain a fast and convenient method to recognize the subcellular location of proteins that do not have specific features. Here, we explored the use of the ML-KNN algorithm for this purpose, which is known to be beneficial for multi-label learning problems [20, 21, 22, 23]. In a test case
(10)
where
Specifically, the prior probability of all labels is calculated based on whether they are training samples or test samples:
(11)
(12)
Next, the Bayesian rule is used to compute the posterior probabilities:
(13)
(14)
where
Finally, we compute the maximum posterior probability using the following two equations:
(15)
(16)
However, the uneven features in the training set will lead to relatively low accuracy. Thus, we developed an improved algorithm to assign suitable weights to each attribute [24]. The weighting factors
(17)
(18)
Figure 1.
Flowchart of the prediction algorithm.
where AvgNum represents the average number of different categories of samples and
2.4Evaluation measures
The following multi-label evaluation indexes [25, 26] were applied to the multi-label test set
2.4.1Hamming Loss
Hamming Loss is an indicator of the frequency with which an instance-label pair is wrong, expressed as:
(19)
Where
2.4.2One-error
The one-error metric evaluates the maximum frequency of inappropriate labels for a given instance, expressed as:
(20)
where
2.4.3Coverage
(21)
The coverage averages the performance over all appropriate labels for a given instance. Thus, performance is inversely proportional to the value of
2.4.4Average recall
(22)
The average recall is used to evaluate the mean value of labels that rank above specific values of
2.4.5Absolute-true
(23)
Absolute-true assesses the ratio of predicted labels that are the same as the actual label set. Thus, performance is proportional to the value of
3.Results
The feature extraction algorithm affects the final accuracy. In this study, the effect of using the entropy density and PseAAC feature extraction methods was examined. The ML-KNN and wML-KNN methods were both applied for comparison of results. The feature fusion method, with simple addition of dimensions, was also used. Overall, better results were obtained when
As shown in Tables 1 and 2, the entropy density and PseAAC feature extraction methods wML-KNN showed better performance than ML-KNN in each evaluation measurement. Moreover, the wML-KNN algorithm achieved better performance than ML-KNN for each evaluation criterion.
Table 1
Results after applying entropy density to different algorithms
| Evaluation criterion | Algorithm | |
|---|---|---|
| ML-KNN | wML-KNN | |
| Hamming loss | 0.1783 | 0.0918 |
| One-error | 0.3576 | 0.1855 |
| Coverage | 0.6099 | 0.2333 |
| Average recall | 0.7844 | 0.9018 |
“
Table 2
Results after applying PseAAC to different algorithms
| Evaluation criterion | Algorithm | |
|---|---|---|
| ML-KNN | wML-KNN | |
| Hamming loss | 0.1769 | 0.0798 |
| One-error | 0.3595 | 0.1587 |
| Coverage | 0.5946 | 0.2084 |
| Average Recall | 0.7871 | 0.9149 |
“
Table 3
Comparative results of two different algorithms adopting the entropy density method
| Algorithm | ML-KNN | wML-KNN |
| Absolute-true | 62.72% | 81.26% |
Table 4
Comparative results of two different algorithms adopting PseAAC
| Algorithm | ML-KNN | wML-KNN |
| Absolute-true | 62.52% | 83.37% |
The comparative results presented in Tables 3 and 4 suggest that using wML-KNN increases the absolute-true rate by approximately 20%. Thus, the same feature extraction algorithm applied to the same dataset gives different results simply by including weight values within the ML-KNN algorithm. Similar changes in the absolute-true rate were observed with both feature extraction algorithms, indicating that the wML-KNN algorithm provides better prediction accuracy.
4.Discussions
Previous PSL prediction studies largely focused on proteins with localization at a single site. Since the discovery of the phenomenon that several proteins have two or more subcellular sites, more attention has been paid to developing multisite subcellular localization prediction and related algorithms. As a multi-label learning method with good generalization ability, the ML-KNN algorithm achieved remarkable results in multisite subcellular localization prediction. Furthermore, using various feature extraction methods and adopting the wML-KNN prediction algorithm can achieve higher accuracy than reported in other studies. For example, using different fusion feature extraction methods, Qu et al. [13] adopted the ML-KNN algorithm to predict multisite subcellular localization in the Gpos-mploc protein dataset, and obtained the best overall accuracy rate of 66.1568%. Lin et al. [9] used ML-KNN as the prediction algorithm to predict a benchmark animal protein dataset and finally obtained an accuracy of 62.88%. Practically, one dataset often contains proteins with both single-site and multisite subcellular localizations. This imbalance in a dataset will inevitably influence the efficiency of the ML-KNN algorithm. Therefore, as an improved version of ML-KNN, we developed the wML-KNN algorithm to reduce the negative effects of this data imbalance in part and to achieve relatively higher prediction accuracy.
The ultimate purpose of studying multisite PSL is to understand a protein’s intrinsic function and obtain new insight into the nature of life. However, to date, the prediction of PSL has stagnated at the theoretical and experimental level. Despite the higher prediction accuracy obtained by adopting our proposed method, more research will be needed combining the results obtained in this study to link the theory to practice in this field. The following details should be considered as a preliminary analysis. First, more standardized protein datasets should be constructed to reduce the imbalance of data and the universality of related algorithms. Second, the entropy density and PseAAC are both effective local feature extraction methods. Thus, effective fusion methods of multiple features is expected to further improve the prediction accuracy. Moreover, the fusion of global and local protein physicochemical features, beyond information of the protein image, may bring breakthroughs in this field. Finally, just as important as the improvement of prediction accuracy described herein, it will be necessary to derive a plausible biological explanation for the results, which can facilitate application of the PSL theory into practice and should be a primary focus of the further work in this field.
Acknowledgments
This research was supported by the Shandong Provincial Natural Science Foundation, China (No. ZR2018LF005), National Key Research and Development Program of China (No. 2016YFC0106000), Natural Science Foundation of China (No. 61302128), and Youth Science and Technology Star Program of Jinan City (No. 201406003).
Conflict of interest
The authors declare no conflict of interest, financial or otherwise.
References
[1] | Bao W, Wang D, Chen Y. Classification of protein structure classes on flexible neutral tree. IEEE/ACM Trans Comput Biol Bioinform. (2017) ; 14: (5): 1122-1133. doi: 10.1109/TCBB.2016.2610967. |
[2] | Yang B, Zhang W, Wang HF, Song CD, Chen YH. TDSDMI: Inference of time-delayed gene regulatory network using S-system model with delayed mutual information. Computers in Biology and Medicine. (2016) ; 72: : 218-225. doi: 10.1016/j.compbiomed.2016.03.024. |
[3] | Manning SA, Dent LG, Shu K, Zhao ZW, Plachta N, Harvey KF. Dynamic fluctuations in subcellular localization of the hippo pathway effector yorkie in vivo. Current Biology. (2018) ; 28: (10): 1651-1660. |
[4] | Yang B, Chen YH. Somatic mutation detection using ensemble of flexible neural tree model. Neurocomputing. (2016) ; 179: : 161-168. doi: 10.1016/j.neucom.2015.12.001. |
[5] | Shang H, Jiang Z, Xu R, Wang D, Wu P, Chen Y. The Dynamic Mechanism of A Novel Stochastic Neural Firing Pattern Observed in A Real Biological System. Cognitive Systems Research. (2018) . |
[6] | Bao WZ, Jiang ZC, Huang DS. Novel human microbe-disease association prediction using network consistency projection. Bmc Bioinformatics. (2017) ; 18: (Suppl 16): 543. doi: 10.1186/s12859-017-1968-2. |
[7] | Diao J, Li H, Huang W, Ma W, Dai H, Liu Y, et al. SHYCD induces APE1/Ref-1 subcellular localization to regulate the p53-apoptosis signaling pathway in the prevention and treatment of acute on chronic liver failure. Oncotarget. (2017) ; 8: (49): 84782-84797. doi: 10.18632/oncotarget.19891. |
[8] | Wu P, Wang D. Classification of a DNA microarray for diagnosing cancer using a complex network based method. IEEE/ACM Transactions on Computational Biology & Bioinformatics. (99): 1. |
[9] | Lin WZ, Fang JA, Xiao X, Chou KC. iLoc-Animal: a multi-label learning classifier for predicting subcellular localization of animal proteins. Mol Biosyst. (2013) ; 9: (4): 634-644. doi: 10.1039/c3mb25466f. |
[10] | Bao WZ, Huang ZH, Yuan CA, Huang DS. Pupylation sites prediction with ensemble classification model. International Journal of Data Mining and Bioinformatics. (2017) ; 18: (2): 91-104. doi: 10.1504/Ijdmb.2017.10007470. |
[11] | Bao WZ, You ZH, Huang DS. CIPPN: computational identification of protein pupylation sites by using neural network. Oncotarget. (2017) ; 8: (65): 108867-108879. doi: 10.18632/oncotarget.22335. |
[12] | Bao W, Yuan CA, Zhang Y, Han K, Nandi AK, Honig B, et al. Mutli-features predction of protein translational modification sites. IEEE/ACM Transactions on Computational Biology and Bioinformatics. (2017) ; (99): 1. |
[13] | Qu X, Chen Y, Qiao S, eds. Predicting the Subcellular Localization of Proteins with Multiple Sites Based on N-Terminal Signals. In: International Conference on Information Science and Cloud Computing Companion; (2014) . |
[14] | Wang L, Wang D, Chen Y, Qiao S, Zhao Y, Cong H, eds. Feature Combination Methods for Prediction of Subcellular Locations of Proteins with Both Single and Multiple Sites. In: International Conference on Intelligent Computing; (2016) ; pp. 192-201. |
[15] | Zhu H, She Z, Wang J. In An EDP-based description of DNA sequences and its application in identification of exons in human genome. In: The Second Chinese Bioinformatics Conference Proceedings; Beijing, (2002) ; pp. 23-24. |
[16] | Shannon CE. The mathematical theory of communication. Bell Sys Tech. (1948) ; 27: : 623-656. |
[17] | Liu B, Wu H, Zhang D, Wang X, Chou KC. Pse-analysis: a python package for DNA/RNA and protein/peptide sequence analysis based on pseudo components and kernel methods. Oncotarget. (2017) ; 8: (8): 13338-13343. doi: 10.18632/oncotarget.14524. |
[18] | Qiu Z, Zhou B, Yuan J. Protein-protein interaction site predictions with minimum covariance determinant and Mahalanobis distance. Journal of Theoretical Biology. (2017) ; 433: : 57-63. |
[19] | Yu B, Lou LF, Li S, Zhang YS, Qiu WY, Wu X, et al. Prediction of protein structural class for low-similarity sequences using Chou’s pseudo amino acid composition and wavelet denoising. Journal of Molecular Graphics & Modelling. (2017) ; 76: : 260-273. doi: 10.1016/j.jmgm.2017.07.012. |
[20] | Liu HW, Yin JP, Luo XD, Zhang SC. Foreword to the special issue on recent advances on pattern recognition and artificial intelligence. Neural Computing & Applications. (2018) ; 29: (1): 1-2. doi: 10.1007/s00521-017-3243-x. |
[21] | Wang X, Zhang W, Zhang Q, Li GZ. MultiP-SChlo: multi-label protein subchloroplast localization prediction with Chou’s pseudo amino acid composition and a novel multi-label classifier. Bioinformatics. (2015) ; 31: (16): 2639-2645. |
[22] | Yang B, Liu S, Wei Z. Reverse engineering of gene regulatory network using restricted gene expression programming. Journal of Bioinformatics & Computational Biology. (2016) ; 14: (5): 18-29. |
[23] | Devkar R, Shiravale S. A Survey on Multi-Label Classification for Images. International Journal of Computer Application. (2017) ; 162: (8): 39-42. |
[24] | Liu J, Jin T, Pan K, Yang Y, Wu Y, Wang X, eds. An improved KNN text classification algorithm based on Simhash. In: IEEE International Conference on Cloud Computing and Intelligence Systems; (2017) ; pp. 92-95. |
[25] | Agrawal S, Agrawal J, Kaur S, Sharma S. A comparative study of fuzzy PSO and fuzzy SVD-based RBF neural network for multi-label classification. Neural Computing & Applications. (2016) ; 29: (1): 1-12. |
[26] | Huang J, Li GR, Huang QM, Wu XD. Learning label-specific features and class-dependent labels for multi-label classification. Ieee Transactions on Knowledge and Data Engineering. (2016) ; 28: (12): 3309-3323. doi: 10.1109/Tkde.2016.. |

