
Modern teaching methods in action in statistical classes
Abstract
To act as a responsible member of a democratic society, everybody needs statistical literacy and practical knowledge on how to use statistical data, visualization, and methods. In the case of professions that use or produce statistical data the correct use of statistics and statistical thinking are also important. Practice and knowledge applicable in real life are also needed. To reach these requirements, using real-life problems, modern technologies (digital solutions, online tools) and up-to-date teaching methods tailored to the target audiences is crucial. Several papers show that the use of real problems, technology and modern teaching methods are more efficient than the traditional frontal teaching method. In this study, we describe some new teaching methods, for instance problem-based learning, project-based learning, thinking-based learning, flipped classroom, gamification, new technological devices. We also discuss the combination of different methods and modern technology in action in the field of Statistics. The paper shares our developments, experiences, and lessons we learnt from classes. One of our main results is the idea that the use of modern teaching approaches leads to more practical and applicable knowledge; however, their success also depends on both the educators’ and the students’ time expenditure and attitude.
1.Introduction
To be a responsible member of a society, it is crucial to understand social and economic phenomena and the relationship between them, which also requires statistical literacy, data literacy, statistical thinking, and practical knowledge of visualization methods. More and more data, tools to analyze and visualize data are available online. Pairing the goal of statistical analysis and choice of the adequate analytical and visualization tools for our goals, the correct use of these tools, and the interpretation of the results become more important both for professional and non-professional users, which re-evaluate the importance of statistics and statistics education. Big data, open sources, visualization tools and the data revolution open new ways and approaches in statistics education [1]. Technology has an effect on the curricula and the learning environment also, which means educators should learn and use new teaching and evaluation methods [2]. Furthermore, the COVID-19 pandemic also affects teaching and learning. More online educational materials were prepared, face to face classes could not be organized. A what and how to teach and learn were a challenge for teachers and students. Practice and knowledge applicable in real life are needed, which lead to two questions: what and how we teach. The answer to the first question depends on several things, for instance the level and the field of the training program, local and national specialties, and needs. The answer to the “How” question should be tailored to the target audience and it is based on the previous answer also. Several papers will be discussed further down, showing that the use of real problems, technology and modern, active teaching methods is more efficient than the traditional, lecture-based, frontal teaching method.
There are several recommendations for the content and the teaching methods.
The American Statistical Association (ASA) formulated six recommendations in the Guidelines for Assessment and Instruction in Statistics Education (GAISE) report [3], which are focusing on what and how to teach in introductory statistical courses. The following:
1. “Teach statistical thinking.
a. Teach statistics as an investigative process of problem-solving and decision making.
b. Give students experience with multivariable thinking.
2. Focus on conceptual understanding.
3. Integrate real data with a context and purpose.
4. Foster active learning.
5. Use technology to explore concepts and analyze data.
6. Use assessments to improve and evaluate student learning.” [3]
The ProCivicStat projects (PCS) was an Erasmus+ strategic partnership of six universities from five countries: the Durham University (UK), the University of Haifa (Israel), Ludwigsburg University of Education (Germany), Paderborn University (Germany), the University of Porto (Portugal) and the University of Szeged (Hungary) [4]. The PCS project aimed at developing new methods in statistical instruction for high schools and tertiary educational institutions (colleges and universities) and contributing to young people’s ability to understand quantitative evidence about the key social phenomena of everyday life and to become more responsible citizens eventually. The project partners developed a theoretical framework to understand civic statistics, lesson plans, and course materials and collected real datasets and visualization tools to be implemented in statistical education at various educational levels and difficulties. The main notion of the PCS project is Civic Statistics, which is a skillset required to understand statistical information about the society. Civic Statistics is not equal to statistical literacy as such but is composed of the intersection of politics, social sciences, statistics, and some degree of educational pedagogy. The notion of Civic Statistics and how it can promote students to become better citizens is described in [5, 6, 7, 8, 9]. The PCS team worked out six key recommendations:
1. “Statistics education activities should promote engagement with social issues and develop learners’ critical understanding of statistics about key civic phenomena.
2. Use relevant data and texts, and highlight the multivariate, dynamic, and aggregated nature of social phenomena.
3. Embrace technologies that enable rich visualizations and interactions with data about relevant social phenomena.
4. Teaching methods should develop skills of critical interpretation of a wide variety of data and text sources.
5. Assessments should examine the ability to investigate and critically understand data, statistics findings, and messages about key social phenomena.
6. Promoting the understanding of civic statistics requires a systemic change and collaboration by relevant stakeholders.” [10]
Ben-Zvi et al. suggest designing an effective and positive statistical learning environment within and outside the school also to more profound knowledge and understandings of statistics, to develop students” statistical reasoning, to encourage students to use statistics. This environment has six interrelated key elements that can be considered as recommendations.
1. “Focus on developing central statistical ideas rather than on tools and procedures.
2. Use well-designed tasks to support the development of statistical reasoning.
3. Use real or realistic and motivating datasets.
4. Integrate the use of technological tools that allow students to explore and analyze data.
5. Establish a classroom culture that fosters statistical arguments.
6. Use assessment to monitor the development of students’ statistical learning and to evaluate instructional plans.” [11]
The recommendations focus both on what and how to teach and have several common points. Educators should focus on ideas and concepts, use real examples and datasets, teach students to think statistically and use technology. Furthermore, from the lecture-based classes educators should move forward to active learning and teaching techniques that engage students in the teaching and learning process better. New teaching methods can lead to new assessment and evaluation forms. The goal of this paper is to show new, active teaching methods in action from our practice. In Chapter 2 we review some active teaching techniques, such as problem-based learning, project-based learning, flipped classroom, thinkingbased learning and gamification. In Chapter 3 classroom examples will be introduced, in which different techniques and the combination of them are used.
2.Active teaching methods
2.1Problem-based learning
The term “problem-based learning” (PBL) is used to cover a wide variety of pedagogical methods and is a teaching approach that gained huge popularity all over the world at every level of education and every field of study due to its versatility and easy adaptability to many educational scenes. Despite the various definitions used to describe the notion of PBL, what is common in all of them is to define PBL as such a pedagogical method that is based on complex, real-life problems and is used to promote learning through hands-on experiences of the students exploring real problems, and through that, developing not only problem-solving but collaborative, critical thinking and communication skills of them as well [12, 13, 14, 15]. Problembased learning is a teaching approach that can be incorporated and tailored to any learning situation and can be used as the primary teaching method other than the traditional teaching principles of presenting methods and theoretical concepts to students directly PBL is a student-centred teaching method, engages students in solving problems themselves where learning is organized around a problem and where the role of the teacher is less of an instructor but more of a facilitator [16, 17]. Some argue that the essence of PBL is not even finding a solution for the problems presented but the process of learning itself.
The origin of PBL ranges back to roughly six decades ago, to the 1950s and 1960s, to McMaster University in Hamilton, Ontario, Canada [15]. Even though the first mentions of PBL are connected to the McMaster University’s medical programs in Canada, many other PBL-approaches developed simultaneously all around the world in the second part of the twentieth century, e.g. in the US (Michigan State University), in the Netherlands (Maastricht University) or Australia (Newcastle University). The main driver behind the development of the new curricula and teaching methodology was to respond to students’ inadequate clinical performance [15]. What if, students even though are having excellent theoretical knowledge, but are lacking hands-on experience and therefore are not able to use their knowledge in clinical practice when faced with complex medical challenges?
The McMaster medical school PBL model [13, 15, 16] is regarded to be the “pure” version of PBL, where the implementation of this educational approach generally happens without including lectures or tutorial sessions, but where students are usually work in a small group on solving a problem together. However, there exist many different hybrid models of PBL with lectures and tutorial sessions supporting student learning embedded in the models.
Certain learning principles need to be considered when designing a course along with the PBL teaching method, which have been summarized in three main approaches, and which also provide a link to another learning method, project-based learning (PBL) which will be introduced in a later part of this paper:
1. Learning approach: a central principle for developing PBL based teaching programs is that learning must be organized around a problem that provides context to the learning process. This principle also stands for project-based learning, where the starting point of creating a project is also having a problem.
2. Contents approach: this approach concerns the interdisciplinary nature of learning Problem-solving can cross beyond traditional subject-related boundaries and methods but can require knowledge and practical skills from other areas as well. Another principle in this approach is the exemplary practice, i.e. that learning outcomes should be exemplary to the overall objectives, and students must get a deeper understanding of the problem they are analysing.
3. Social approach: this the principle of learning in teams. Learning in PBL not only happens individually but rather in a social context. Therefore most of the learning happens when students are collaborating and self-direct the learning activities, having some degree of autonomy in managing their learning process as a team [13, 17].
The implementation of PBL is not unprecedented in statistics education, as this approach provides a better view of linking real-world phenomena with the methodology and statistical analyses to the students. Papers investigated the implementation of a PBL-based teaching or tutoring approach in statistics courses at undergraduate [19, 20, 21] and postgraduate level [22, 23] in different fields, such as mathematics [22], health sciences [19, 23], medical studies [24] or psychology [20]. Evidence suggested that the implementation of a fully integrated PBL teaching approach or introducing elements, such as directive tutor guidance not only results in students performing relatively better compared to others receiving traditional education but can contribute to the better understanding and linking of statistical concepts with other areas of their studies. PBL in statistical education also enhances students’ motivation towards learning statistics and promotes self-directed learning and yields in students memorizing the materials in the long run as well [19, 20, 21, 22, 23, 24].
PBL is undeniably a more interactive pedagogical approach compared to traditional educational settings and helps to develop the key learning skills in any area greatly, and as well can promote the further development of such interpersonal skills like communication, time management, teamwork, collaboration and identification of key problems. Another benefit of PBL is that this method has the potential for increasing learners’ confidence through supporting their professional development. Students learning in PBL can feel that they are treated as equal partners by the teacher and not as inferior to the teacher, thanks to the facilitator role of the teachers, where they do not dominate the discourse but complement and support the learning process. PBL requires a different approach from teachers, who have been mostly trained in the traditional educational setting and as well requires significant preparation especially when introducing PBL. PBL is therefore rather time-consuming to set up and so is to facilitate, as the teachers need to be equally present for each learning group and dedicate equal attention to each of them. Being a facilitator in PBL is not only challenging for the teacher because of time-management concerns but also because teachers need to face the challenge of stepping back from their traditional teaching role and take a more collaborative stance in the entire learning process. Several times problem-solving needs technical equipment to be at hand as well, which might mean some structural changes in the environment of teaching (e.g. the availability of a computer room).
2.2Project-based learning
Project-based learning (PjBL) is an instructional form and pedagogical approach sharing many similarities with the previously introduced problem-based learning (PBL), even, in many cases is used as a synonym for PBL methodology (hence the use of the same abbreviation, PBL for both in many papers Here we use different abbreviations to make the distinction between the two methodologies clear), because of being equally student-centred [13, 25, 26, 27]. The origins of PjBL date back far earlier (to the late 19
Project-based learning is not only a pedagogical method, but an entire learning environment is not focusing only on how to develop student skills and how to deliver study materials, but also on community actions and the use of technology to promote better learning and collaboration of students and other actors in the learning process [13, 28]. Krajcik and Blumenfeld (2005) summarized the five main features of a project-based learning environment are:
1. The first feature of a PjBL classroom of having a drivingquestion is very similar to the problem-based learning approach. In PBL students most commonly receive a problem from the teacher which is usually of a lower scale (e.g. a problem that can be discussed in a shorter time, as in the frame of one lecture or just a few lectures). However, in PjBL students are encouraged to ask questions which are driven by their curiosity and entire research projects are built around such an inquiry [26].
2. An essential feature of a PjBL classroom, situated inquiry, means that students can work on their project and can try to find solutions for a real problem using authentic methods that real-life professionals could also do when solving a similar problem. This does not necessarily imply that classrooms should be transformed into e.g. actual scientific laboratories or research centres. However, by trying to simulate actual research activities and scientific practices, students not only would get a better overall picture of the given area but can engage better in the discussed topic if they can focus on them for a longer period instead of directed, short-term exercises in the traditional classrooms [28].
3. Apart from the situated learning environment, collaboration is just an essential element of PjBL: by working on projects together. Students can improve their organizational and conflict-resolution skills as well and learn how to plan a project, manage the distribution of tasks, communicate efficiently and in a respectful manner with each other, the latter of which rarely occurs in traditional learning environments when students do not need to work with each other. In the PjBL classroom, not only students are collaborating, but the teacher takes on a supervisor/facilitator role -but not a facilitator role as in PBL-, and other members of the society can participate in the project as well [27].
4. The use of technological tools to support learning is not a new notion in teaching. However its use is especially emphasized in PjBL as it can broaden the spectrum of opportunities for the students when looking for the solution to their problem and as well can emulate the actual activities real professionals might do. By introducing digital tools in the learning process, students’ work can also mirror reallife situations better, as in reality professionals would also have access to a wide range of tools and information and so would students, compared to just the textbooks in that certain study area. Students might face challenges at first on how to navigate between the vast amount of information they can utilize. However, here is where the teacher’s facilitator role becomes important, and by helping them to learn how to manage data efficiently, students become more confident in their skills which is also a great long-term investment concerning the future application of their studies [26, 28].
5. An essential feature of a project-based classroom, which differentiates it from a problem-based approach, is that the problem-solving process, the project itself, must conclude in the creation of an artefact, which presents the solution for the initial question the project was based on. In the case of problem-based learning, the focus is more on the process of problem-solving itself and the techniques used to examine the given problem, while finding a solution or answering the initial question is not a necessary element of PBL teaching but is a must in PjBL [25, 27].
As it could be seen from the above description of both PBL and PjBL, we can see that both are student-centred and problem-based teaching methods. However, there are some considerable differences between the two approaches. The first difference between the two methods is that while PBL is equally as problem based as PjBL, the latter requires a solution for the projects, as the aim of the entire research project is the creation of some sort of an artefact at the end In PBL the focus is less on the outcome of the problem-solving but the learning process itself; providing a solution is not a necessary element of PBL and neither is the production of some sort of an outcome (a presentation or a report). Second, the role of the teacher is even though a supportive role in both approaches, in PBL teachers act as facilitators in the problem-solving process, guiding students through the process. In PjBL teachers are supervising the process but are not giving direct guidance to the students. Third, the way of actual teaching in the two approaches differs as well. While in PBL students are expected to work out their learning requirements, in PjBL students receive some degree of tutoring in the form of actual teaching during the lifespan of the project. This means that in PjBL students are delivered the materials in a more direct form by the tutors during their education than in PBL teaching. Fourth, the timing of when to apply these approaches can differ. The aim of PBL is often to discover a topic together by assuming that students already have some degree of propositional knowledge (but it is not necessary to have covered the entire subject), while the application of PjBL can happen later in teaching programs, after assuming students already possess the amount of knowledge required to tackle a research project. The last, fifth difference is that PBL is based on the assumption that learning can happen by crossing interdisciplinary boundaries, while the same is the aim of the PjBL project: the main goal of PjBL projects is to bring together distinct study areas at the end of a course or training project. Accordingly, even though many refer to PBL and PjBL to be synonymous, what differentiates between these two approaches is that while PBL is an overall educational strategy applicable at all levels and phases of study programs, PjBL is rather an instructional tool or teaching technique applicable at a given area in the curriculum [25, 27].
Many recent studies [29, 30, 31, 32, 33, 34, 35] show that implementing a project-based view either for an entire statistics course, a module in a course or as an assessment tool can result in the improvement of student engagement and admittedly make them learn more compared to traditional education. Students seemed to favour projects to be included in statistics because they could learn better in such an environment that simulated future work and could obtain skills that are valued at the labour market as well. Modern statistical education, therefore, is an area that can benefit substantially from a project-based learning approach by empowering students not only with analytical knowledge but with a different way of thinking and a wide range of intangible skills that will be valuable in their future professional advancement.
2.3Thinking-based learning
Thinking-based learning (TBL) is a teaching method to improve the quality of students’ thinking, enhance their content understanding and learning that improves the quality of their lives, including their work after they leave school [36]. TBL is one of the most suitable tools in the 21st century that infuses the teaching of critical and creative thinking into content instruction [37]. TBL aims at developing more intricate thinking skills far beyond pure memorizing. It promotes skilful thinking, which refers to the use of proper thinking skills for specific tasks [38]. Skilful thinking is where the thinker assesses what is required to accomplish a thinking task and consciously applies the thinking skills and mental behaviours in a strategic combination to produce thoughtful products of high quality. Educators should infuse instruction in skilful thinking into content instruction what means not only teaching students the thinking skill but also teaching them to use the appropriate forms of thinking skilfully [37]. Why is it worth proving skilful thinking with TBL and incorporating this teaching method into higher education? First, TBL provides highly detailed, step-by-step procedures and guides by which it can be used efficiently in higher education [39]. Second, there is empirical evidence that these practices can both improve students thinking and make university courses more interesting for them.
Skilful thinking has three components and all of them must be considered to apply the TBL method successfully: thinking skills, habits of mind (or thinking dispositions) and metacognition. Thinking skills refers to generating ideas, clarifying ideas, and assessing the reasonableness of ideas [40]. Critical thinking skills refers to being able to analyze complex problems, investigate questions, evaluate different points of view or sources of information, and draw appropriate conclusions based on evidence and reasoning [41]. Critical thinking characterized as a purposeful mode of thinking about content, a subject, or a problem, which involves different components [42]. Thinking critically plays an important role in innovations. The recognition that a new approach is required to solve the problem is based on knowledge and understanding of the situation. Moreover, there is judgment involved in determining the broad range and form of possible solutions to problems or how to proceed [43]. These skills can be developed by several kinds of thinking processes: critical thinking activities, activities requiring evaluation, excursions into analysis, classification projects, requests for prioritizing tasks and items, engagement in problem-solving, thinking about options, creating an argument, or developing creative ideas [44].
Habits of Mind (HOM) are related to guiding those procedures to perform broad and productive thinking. This concept implies paying attention to the context to select useful and appropriate thinking skills to complete a complex task [38]. Costa and Kallic (2009) isolated 16 different parts of HOM: persisting; managing impulsivity; listening with understanding and empathy; thinking flexibly; thinking about your thinking; striving for accuracy; questioning and posing problems; applying past knowledge to new situations; thinking and communicating with clarity and precision; gathering data through all senses; creating, imagining and innovating; responding with wonderment and awe; taking responsible risks; finding humour; thinking interdependently; remaining open continuous learning [45].
Metacognition is related to the awareness of one’s thinking to improve learning. It refers to the use of thinking skills and habits of mind, based on the person’s assessment of the task [38]. Metacognition is often simply defined as "thinking about thinking." However, defining metacognition is not that simple and there are several terms currently used to describe the same basic phenomenon (self-regulation, executive control) or an aspect of that phenomenon (meta-memory), and these terms are often used interchangeably in the literature [46].
The components of skilful thinking are strongly related to Bloom’s taxonomy. This framework, originating from a dissatisfaction with the outcomes of students’ learning in higher education, is one of the best approaches for school education. The framework has six objectives: knowledge, comprehension, application, analysis, synthesis, and evaluation. The final four objectives collectively defined as “higherorder thinking” [47]. Considering Bloom’s taxonomy and the factors of skilful thinking, Swartz and McGuiness have created eight principles that should be followed to effective TBL application in classes:
1. Teach explicit thinking strategies in the classroom.
2. Prompt the students to do the thinking that results from their use visible and public.
3. Advance deep-thinking challenges using engaging questions as a form of prompting rather than didactic instruction.
4. Engage students in collaborative thinking to ensure joint meaningmaking, interaction, and dialogue.
5. Prompt students to adopt a strong metacognitive perspective.
6. Explicitly teach to facilitate the transfer of the learned thinking procedures to other curricular and non-curricular contexts.
7. Cultivate thinking dispositions and habits of mind.
8. Generalize the instructional approach used in thinking classrooms to multi-grade and multi-subject curricula [47].
The TBL method has already been successfully applied in primary and secondary schools, but the method is also receiving more and more attention in higher education [38, 42, 44]. There are countless opportunities for using TBL methods and combining them with other teaching and learning methods through real-life examples when we develop statistical thinking and reasoning in Statistics courses. In Section 3 we show an example of it.
2.4Flipped classroom
Flipped classroom (FC) or inverted classroom is a pedagogical approach where “students engage in the relatively passive content learning before class (typically by viewing lectures online at their leisure and ideally reflecting on content), allowing for in-class time to be dedicated to the active learning of content (e.g. problemsolving, assignments, group work, quizzes, etc.) with a peer mentor and instructor support available” [48]. This approach has emerged from primary and secondary education [49] and became popular in post-secondary education about a decade ago [50]. The role of online class models such as flipped classrooms has been highly important due to the COVID-19 crisis [51, 52].
There are several advantages of using the flipped classroom approach. It allows students to learn at their own pace and have a deeper understanding of educational material. The prior learning frees up class time which can be utilized for active learning (e.g. discussions, group work, quizzes etc.) [53]. If students are actively involved in the learning process, it leads to higher motivation, confidence, and critical thinking skills [54]. The self-paced learning at home and the learning activities in classes can also result in higher levels of satisfaction [55] and engagement [56]. Based on a meta-analysis [48] it is highlighted that student’s performance was higher in a flipped classroom than in a traditional classroom in most of the examined studies. The paper of Gundlach et al. (2015) showed that traditional students scored higher on average on the exams compared to flipped students but Gundlach et al. explain that by less face-to-face class time in the flipped classroom compared to the traditional one or by the instructor’s higher experience on the traditional lecture [57].
Several activities can be applied in flipped classes. O’Flaherty and Phillips (2015) highlighted that a flipped class has pre-class (asynchronous) and face-to-face (synchronous) activities. They mention among pre-class (asynchronous) activities podcasts/vodcasts, screencasts, annotated notes, videos, use of pre-readings, interactive videos, case-based presentations, or simulations. Among synchronous activities case-based presentations, team-based discussions, panel discussions, expertled discussions, role-plays and student presentations, discussions and debates are mentioned [53]. However, we must note that during the pandemic due to the social distancing, synchronous activities have been held not face-to-face but via video conferencing platforms; some of them have built-in online voting systems which can be used for synchronous activities.
Concerning the class sizes, flipped classrooms can be used in small or large classes too. Farmus et al. (2020) found that the size of the class does not moderate the flipped classroom’s effect on student performance [48]. Nielsen et al. (2018) pointed out in a large class that flipped classrooms improve student performance [58], but there are studies with small sizes [55, 59] where the positive effect of flipped classrooms on student performance is observed. Furthermore, if we are considering the size of flipped content, we can state that flipping works well for an entire course but partially (e.g. flipping only the most challenging content of the course) too [60].
Flipped classrooms are applied in many different fields, but there have already been several examples in the field of statistics education. These studies [55, 57, 58, 59, 61, 62, 63] examined the effect of the flipped classroom on student performance by using a control group which is a traditional classroom. Most of the studies found that a flipped classroom improves performance. However, Gundlach et al (2015) pointed out that the traditional classroom had an advantage over the flipped classroom, which is explained by less face-to-face class time in the flipped classroom compared to the traditional one or by the instructor’s higher experience on the traditional lecture [57]. Besides student performance, increased satisfaction [55] and higher course evaluation scores [58, 59] are mentioned as a positive consequence of flipped classrooms in statistical applications.
Beyond the advantages, there are some challenges to face during a flipped classroom application. Preparing for a flipped classroom requires extra work from instructors for creating pre-recorded classes and planning in-class activities [48] and it also requires substantial IT support both from the side of students and educational institutions as well [56]. However, those burdens can be eased if not the entire course but only the most important parts are flipped [60]. There is also a danger from the field of students if they do not watch videos at home, and it can result in inefficient conversations in classes [56]. Nevertheless, if someone is aware of the challenges of a flipped classroom and prepares for them (e.g. by using additional training the educators or by using exciting elements – such as visualization tools – in pre-class materials) the application of a flipped classroom could be successful.
2.5Gamification
In recent years gamification has been studied a lot, since the number of companies and sectors who implement this method for instance to encourage workers to work better and more or to learn things, is rising continuously. Several definitions exist to explain this concept. One of these is the definition of Nick Pelling who said that the essence of gamification is that the elements and mechanisms specific to (computer) games are used by users in non-playful environments [64] Helgason stated, it is “the adoption of game technology and game design methods outside of the games industry” [65]. Another definition says that gamification is “the process of using game thinking and game mechanics to solve problems and engage users” [66]. Based on Bret Terill’s thoughts, gamification is when we are “taking game mechanics and applying them to other web properties to increase engagement” [67] which is one of the earliest definitions for gamification [68]. In these definitions there are many overlaps. However, everybody agrees that the word gamification covers “game-based mechanics, aesthetics and game thinking to engage people, motivate action, promote learning, and solve problems” [69] in non-game situations. Gamification means not only trying to bring the motivational power of digital games into education but also using the game as a pedagogical model, as a general form of learning specific to the children. The essence of gamification is not only to play computer games in school, but to use the game as a learning model for more effective learning, especially for continuous motivation [70, 71].
We must face a new generation in schools which is named NetCoGame generation by Fromann. We can communicate with them almost exclusively through the language of gamification and playful mechanisms. [72]. According to Lee and Hammer “understanding the role of gamification in education means understanding under what circumstances game elements can drive learning behaviour” [73]. Regarding this, gamification can be one possible good solution to fulfil the needs of this new generation [74]. Because besides applying the potential of ICT tools, gamification is working with a strategy that covers a huge part of the teaching-learning process by using the motivational elements of playing (scoring, levelling, competition). These ensure the expectations of Generation Z and the positive experiences of the learning process and a longer-term commitment to the acquisition of knowledge [74, 75]. So to say, the key strategy of gamification lies in providing rewards and competing after the completion of the desired tasks. Hamari et al. after their literature review on empirical studies of gamification categorized the tested motivation affordances into ten categories which are the following: points, leaderboards, achievements or badges, levels, story or theme, clear goals, feedback, rewards, progress, and challenge [76].
The reason behind the widespread usage of this method is rooted in its lot of advantages. Kapp says that it increases the engagement of students [69] for example, by telling an exciting storyline. He also mentions as a fact, that it helps education to get closer to realworld contexts and problems. It is the result of that the process of problemsolving during playing the games that develop skills that can be used in the real world to solve complex problems. Another advantage of this method is that it applies and practices learning within a meaningful and authentic context. Furthermore, it promotes the practice, teamwork, and the community of learners in the case of games which requires collaboration to win [77]. Squire mentions that there are examples for gamification, like “Water Challenge” from Minecraft or “Supercharged” from MIT, which places students within systems where they can safely manipulate or explore different kinds of functions [78]. Reference [79] adds two more advantages to this list. One of these is the creation of enthusiasm. It says that gamification can foster enthusiasm in the case of subjects that students struggle with like math or programming. These games also provide constant feedback for the players by using not only points or coins but also leaderboards or dashboards.
Naturally, this method also has its disadvantages besides the advantages. A disadvantage of gamification is that when the rewarding stops, users will likely not continue playing unless they find another motivation to keep gaming [75]. Also, “some research has found using badges and leaderboards may lead to negative outcomes for intrinsic motivation and class satisfaction compared to a non-gamified course” [81]. Another disadvantage is that if the game is not well-structured and a player fails a lot, it can create demotivation or fear of playing. In addition to these, the earlier mentioned motivation systems only work for naturally competitive students, but the others who are not can lose interest very fast. Students also can be distracted from the learning objectives. For example, a poorly designed game can lead to disengagement or it can also cause problems when the game is not implemented into the curriculum effectively [77]. Based on the opinion of Ford gamification can be very costly. For example, if we want to implement complex gamification systems into education, we need to buy or develop expensive software, or the educator is required to go to training [79]. Computers and internet connection needs also can be mentioned here [77]. However, such equipment is part of our everyday life. Many times game logistics also mean a big obstacle because setting up a complex game requires a lot of prior planning and logistics. These are not always worth the effort due to the other disadvantages, like decreased student attention which is caused by the fast pace of the game and the immediate feedbacks. Students tend to expect these from all parts of their education, and lack of it can lead to uninterest [79]. Gamification games can also lead to addiction or overstimulation because competitive and perfectionist students tend to play too much to pass a level or get forward on the leaderboard. An additional disadvantage mentioned by Bellotti et al. is that it can blur the boundaries between virtual life and reality [77].
Fortunately, many of these disadvantages can be prevented by good planning and implementation and with monitoring of students’ playing habits. There are many good examples of gamification software or voting systems that are already used in education and can support or supplement the curriculum but in different ways. In this section we would like to demonstrate some of these without attempting to be comprehensive.
Kahoot is a multiple-choice quiz software that makes teachers able to test the knowledge of students or make them compete against each other during the classes. The questions of the quiz should be programmed in advance by the teacher. Students need computers with Internet connection to log into kahoot.it webpage or any smart device with downloaded Kahoot app on them. When the quiz begins, students can read the questions and the possible answers on the board, while they can vote for the correct answer via their computer or smart device within a certain period (e.g. 20 seconds). It is not only important to choose the correct answer but also speed counts. The faster gets the more points. The students can see the top 3 after every answer and at the end of the quiz there is a final ranking based on the number of good answers and the speed. Kahoot is a good example to make testing more fun and to encourage students to study and be ready to get tested anytime.
VoxVote is an application, is very similar to the previously mentioned Kahoot. However, it can be used not only for quizzes but also to make pool voting or realtime surveys and it is free for educational institutions. Students or respondents can join the quiz or the pool in the same way as described in the case of Kahoot. In the case of open questions, it is suitable for creating realtime word clouds from the answers given. Right after the questions are answered, the distribution of answers can be seen, and the results can be exported into an Excel sheet.
Entrepoly is a serious game which aims to develop entrepreneurial skills with the help of gamification. “Serious games are considered to be the tools of gamification”. The content of Entrepoly can be customized by the teacher which makes it easily adaptable. Students can create their avatars and collect golds by completing playful tasks, while teachers can monitor their progress continuously [68].
Minecraft is a popular, widely used, and well-known game amongst the young generation. In this world everything is built from pixels and children are free to use their creativity and to collaborate with others. The Education Edition of the game offers lesson plans and downloadable worlds to help teachers to integrate the game design into the classroom. In addition to this, there is a Minecraft professional learning community where educators can connect to others to share lesson plans or other resources.
Archy Learning, a gamified e-learning platform is a place where teachers can put YouTube links and classroom notes into a learning pathway. It uses gamification within its class quizzes, educational video games, mixed media exams and awarded certificates after completing courses. This is a gamified classroom which can be used from everywhere.
Exploristica, which won the International Statistical Literacy Project Best Cooperative Project Award in 2015, teaches important statistics and probability concepts with the help of games and gamification. This project is a cooperation of the Portuguese Central Statistical Office, the Portuguese Statistical Society and Lifetime Lab.
These examples demonstrate how many ways gamification can be used and implemented in education. However, there are also many other kinds of apps which are built on gamification, like flash card apps, language learning apps, applications which teach how to code or even gamified apps which help to learn to play instruments. The list of possibilities is endless and constantly growing.
3.Modern teaching methods in action
In Chapter 3 we show the active learning teaching and learning elements and the mixture of them in action, which backgrounds were introduced in Chapter 2.
3.1Analysing Civic problems
The PCS project has developed teaching materials, use authentic large-scale data in such topics as income inequality, migration, ageing society, sustainable development goals, or human development, often presented in innovative ways. Lesson plans, teacher and student versions of the materials, datasets, review of dynamical visualization tools, conceptual framework, syllabuses, workshop materials, publications, and other various collections are available at the project website in English, and selected materials are available in German, Portuguese, and Hungarian languages as well at http://iase-web.org/islp/pcs/. Study materials and syllabuses are all heavily infused with modern techniques, such as the use of gamification elements, problem and projectbased learning approaches, and as well emphasis on the use of visualization and modern data analysis tools in the classroom, together with encouraging the use of technology and smart devices, again, a method unconventional in traditional education.
PCS materials at the University of Szeged have been implemented in various groups concerning the size of the group (from small groups of 20–30 students to large classes of 500+ students), their study level (from high school to master students) and study area (business and law education). At first, the implementation of PCS project study materials served the purpose of testing the materials at various statistics-related courses in business education [82]. The developed PCS teaching materials follow a rather practical and problem-based approach and build the presentation of statistical tools around very relevant current social and economic problems. The introduction of such teaching materials both in introductory statistics courses and as an entirely new optional data analysis course at the bachelor level resulted in major success from the students’ side.
To provide an example of how PCS teaching materials work, let us look at one lesson focusing on the topic of Ageing society. A version of the Ageing Society lesson has two blocks and contains several questions and activities. The first block concentrates on basic terms: age distributions, the use, and the interpretation of (online) population pyramids. The second block focuses on the ageing society. The class can begin with a warmup question such as “which country has the oldest population?”. Then we continue in a group discussion. Students think about the meaning, causes, consequences of ageing society and present their idea. The next question is how we can measure/examine/visualize the ageing society, causes and the consequences. In the first round, students give ideas about potential indicators that can be used and describe why they have selected the indicators, what was their process of thinking. After these presentations we consider the indicators, used by official statistics to measure ageing society. We focus on the Old age dependency ratio and the Ageing index.
After the discussion phase students use statistical data sources and visualization tools to analyze the problem. For instance, students can analyze both national and international levels the ageing. We can use for instance the Gapminder, online population pyramids, international and national statistical data sources to compare the age distributions of different territories in the same year or compare pyramids of territory between different years to do comparison and interpretation. We can compare not only the pyramids but the indicators also. For instance, ask the students to calculate and compare the Old age dependency ratio, and the Ageing index for the years 2000, 2020, 2100 in the case of a country. Seeing the result, we ask the students to formulate (critical) questions from methodological, social, and economic points of view.
Students reported that they enjoyed problem-based learning materials and felt more motivated to participate in the discourse during classes. They also appreciated the facilitator role of the instructors and felt that they could better discover certain topics this way. However, they often had difficulties in linking knowledge elements from different areas as this have not been the general practice in their study programs and as well understanding the importance of the discussed topic and the relationship between civic engagement and the discussed topic resulted in being challenging for them Although students faced some challenges in working with the PCS materials, their overall experiences and opinion remained predominantly positive, reporting that these materials made the otherwise compulsory and less-enjoyable introductory statistics topics a bit more palatable and likeable.
At the same time, educators faced challenges in implementing PCS materials in their courses as well. Compared to traditional statistics classes, when PCS materials were introduced, teachers needed to take an interdisciplinary view as well, preparing in advance from the social context and the relationship between statistics, civic engagement, and the social content of the lessons, therefore preparing for such classes resulted in being rather labour-intensive, requiring significant extra preparations at the beginning. Educators also faced the challenge of how to find the right balance between the statistical methods, the use of digital tools and the social aspects of the discussed topic and as well how to emphasise the importance of each of these elements in class, how to engage students equally in the elements of PCS teaching materials (digital tools, statistical methods, social issues).
3.2Project work at master level
In this part we are providing an example for introducing a project-based learning methodology at a master level Statistics course in marketing education for firstyear students. This course is a 14 weeks-length course and takes 4 hours weekly. Statistics is a compulsory statistics course for firstyear marketing Msc students where one focus of the course is on the practical application of PPDAC (problem-plan-data-analysis, conclusions) statistical-inquiry cycle, and on developing students statistical thinking. The application of hierarchical cluster analysis, factor analysis in marketing-oriented research are new topics of this class.
Project-based learning usually assumes that students already possess a substantial amount of prior knowledge [25, 27]: it is no different from this time either. Students usually join this course after having at least two semesters of introductory statistics courses at bachelor level, as an antecedent to this course, at which they have covered the basics of descriptive statistics and inferential statistics, already being familiar with the notion of population, sampling, estimates or hypothesis testing, relationship analysis (correlation analysis, bivariate regression, crosstabs analysis).
The entire course is built around a research project that the students are conducting in groups of 3 to 5 persons, and which concludes in the creation of a presentation which constitutes 50% of their assessment in the course (alongside with a test which mainly assesses their practical knowledge about the cluster and factor analysis). Accordingly, by the time students engage in their research projects, they are (supposedly) already equipped with ample statistical and analytical knowledge and skills. In their project, which ranges through the entire semester, students form teams of 4–5 persons and carry out their primary research to solve university service-related problems for the community of the university. An important feature of the PjBL approach in the case of this course is summoning university stakeholders to join the discourse: the problems students are seeking to solve are always coming from a service provider. The different service providers of the University of Szeged (the Career Office, the University Book Shop, the University Gift Shop, the Alma Mater Office etc.) are supplying the students with their current problems (e.g. the number of students participating in volunteering programs announced by the Alma Mater Office is very low or the sales of the Gift Shop are not improving despite an at that time recent introduction of a new online store or what the customers think about the Coffee Shop’s supply of goods or what the future of the copy saloon), for which they are expecting solutions and recommendations from the students. The introduction of university stakeholders puts the research project into a real professional setting where marketing students need to conduct their research in close contact with real actors at the university. Their “job” as part of this course is therefore not a simulation but is a real research where the results of their projects will have actual implications. If students can come up with an excellent solution for one of the problems, that is of great value to the university undoubtedly. However if they do not deliver an excellent solution, they do not get punished, as if they would get in real life. This project aims to make students learn the use of statistical analysis methods by doing, to challenge students in a professional setting, and to get a taste of what an actual research will look like in their future as marketing professionals, but at the same time in a supportive environment to foster learning.
Service providers are invited to the first class and present their general problems, to which they need an answer. At the beginning of the course students need to form teams and choose a university stakeholder. When the teams are formed and are matched with their service provider partners, they are required to meet with them regularly to know the client, to understand the problem deeply. Based on the meetings, students are needed to formulate their research question, a driving question which will orientate their work onwards, what kind of data and data collection are needed, what is the target group, schedule of the research, etc. and they present a research plan to the educators and the representatives of the clients during the 4
The resulting artefacts of the group projects are presentations in the exam period providing the university stakeholders with solutions and suggestions for their problems. Teams can present anytime between week 14
Their research question and research plan are discussed during one of the classes -which are held parallel with the group projects throughout the semester to teach new analytical methods to the students, just as how some tutoring can complement PjBL teaching [25] and is fine-tuned if needed. University peers can express their opinion not only on the survey but also on how the collaboration is going so far, whether they could understand each other with the student team or not, providing students with feedback concerning their work, which supports the learning procedure and helps students identify their weaknesses even during the project.
This teaching method is challenging both for educators, service providers and students. In this process the role of the educators differs from the frontal teaching methods: supervise the whole research process and differentiate based on the problems and progress of the different groups. Furthermore, educators have to know each other, cooperate with the clients also, and have to understand the viewpoint and the requirements of the partner also. For instance, students have to present their results correctly but in an understandable way for non-statisticians as well (how and how deep we present the used method, results, etc.), statisticians also have to learn and show it during the class. It is also a good teaching and learning technique to bring the business and the academic side closer together. Several times the service providers’ issues do not require the use of factor analysis or cluster analysis. In the project work there are no requirements for the statistical techniques, and groups have to tailor it to the problem and the research design. This is the reason that the course is moving on two parallel paths and the evaluation has two parts: the project and the tutoring sessions. During the tutoring sessions, the application of certain statistical analyses is taught to students in a more traditional frontal form of education too. Nevertheless, at these sessions, attention is still paid to initiating collaboration by fostering a problem-based approach, establishing activities on real datasets and questions, and trying to solve them during the tutoring sessions.
This methodology has been applied at the Statistics course for quite a few years now and student feedback has been positive overall: students enjoy participating in large-scale research projects which have some real implications and the collaboration with university stakeholders creates the feeling of a professional environment. Students report the peers treating them as equals, which gives them some degree of confidence and makes them more engaged and motivated in working on the project as they are seeking approval from the university stakeholders. There is a healthy amount of rivalry among the teams (even though there is no competition aspect of evaluating the projects) and this competition is also driving them for further excellence, making them perform better at classes (which is also attributed to better engagement). They admit that this form of statistical education requires significantly more effort from their side; they need to prepare for the course more as if they were just solving directed sample exercises during class. However that feeling of “realness” in the entire research project is making them more engaged in this form of education than in a traditional class, making the project-based learning in the Mathematical Statistics course a successful teaching method.
3.3Analysing visualizations
Data are often communicated through graphs and charts because they allow the skilled user to quickly recognize and extract important features of the data set under analysis [83]. Nowadays, visualizations are surrounding us everywhere. Thinking about the advertisements and news on the television or thinking about social media where countless information sources and personal opinions are producing a large quantity of data, and providing new data on how people feel, almost about anything. Science also uses infographics in the attempt to reach people and simplify communication, bridging different knowledge backgrounds and cultures [84]. In the case of visualizations, it is crucial that what we want to show, what the prepared visualization shows, and what the viewers perceive and understand have to be the same. Visualization makers must consider the goal of the visualization, about what, how and for whom they want to visualize.
Data visualization is also regarded as a critical skill for today’s data-centric jobs. As such it is frequently found in job postings and the demand for people with this skill increasing exponentially at about 1500% in the past decade [85]. Users also need to have the appropriate skills, which can be called visual literacy to understand these figures and get essential information from them. That is why students also need to be visually literate just as they need to be verbally literate, but visual literacy is often overlooked in undergraduate education [86]. However, interpreting figures does not only provide new information sources but greatly improves the learning process and the way of thinking. This kind of learning as part of what can be called multimedia learning fosters deep learning [87].
At the bachelor level in our introductory statistics courses, we seriously take care of our students’ visual literacy. Using simple and complex figures from real-life examples we try to integrate the thinking-based learning (TBL) method into traditional curricula and encourage students’ critical thinking. In the first part of this lesson, the educator presents the theoretical background, short history, trends, and challenges of data visualization. This part includes the meaning, types and examples of data visualization, the formal requirements of graphs and charts, and the general expectations for figures. This is the basic theoretical knowledge that students need to understand and apply in later parts of the lesson. In the second part, various kinds of real-life figures are presented and analysed that students may have already seen in media (e.g. television news or newspapers) before. These figures are often rather subjective, seemingly simple but not correct from a statistical point of view because these have been made for some special purposes (e.g. advertisements on TV or newspaper, social media news, etc.) Also, these figures do not meet the general requirements of statistical figures that students learned in the first part of the course (e.g. missing formal requirement elements; inadequate proportions; misleading title or captions, or graph types selected incorrectly). Instead of asking a simple closed question, like: What do you think, is this figure correct or not, figures are analysed, and students are asked: “What do you think about this figure? What is illustrated on the chart? What is the message of this figure? What is the purpose of this chart? What about the formal requirements that we have learnt? Do they satisfy them?” The teacher lets the students express their own opinions in the class. This work can be managed as individual or group work also. Meanwhile, the educator collects the different opinions on the board. At this step, students are asked to form critical questions. This is the discourse, the so-called active thinking, in which phase students try to explain their thoughts, even defend them if they see it is necessary. Metacognition is when we encourage students to try to think with the mind of the creator of the figure.
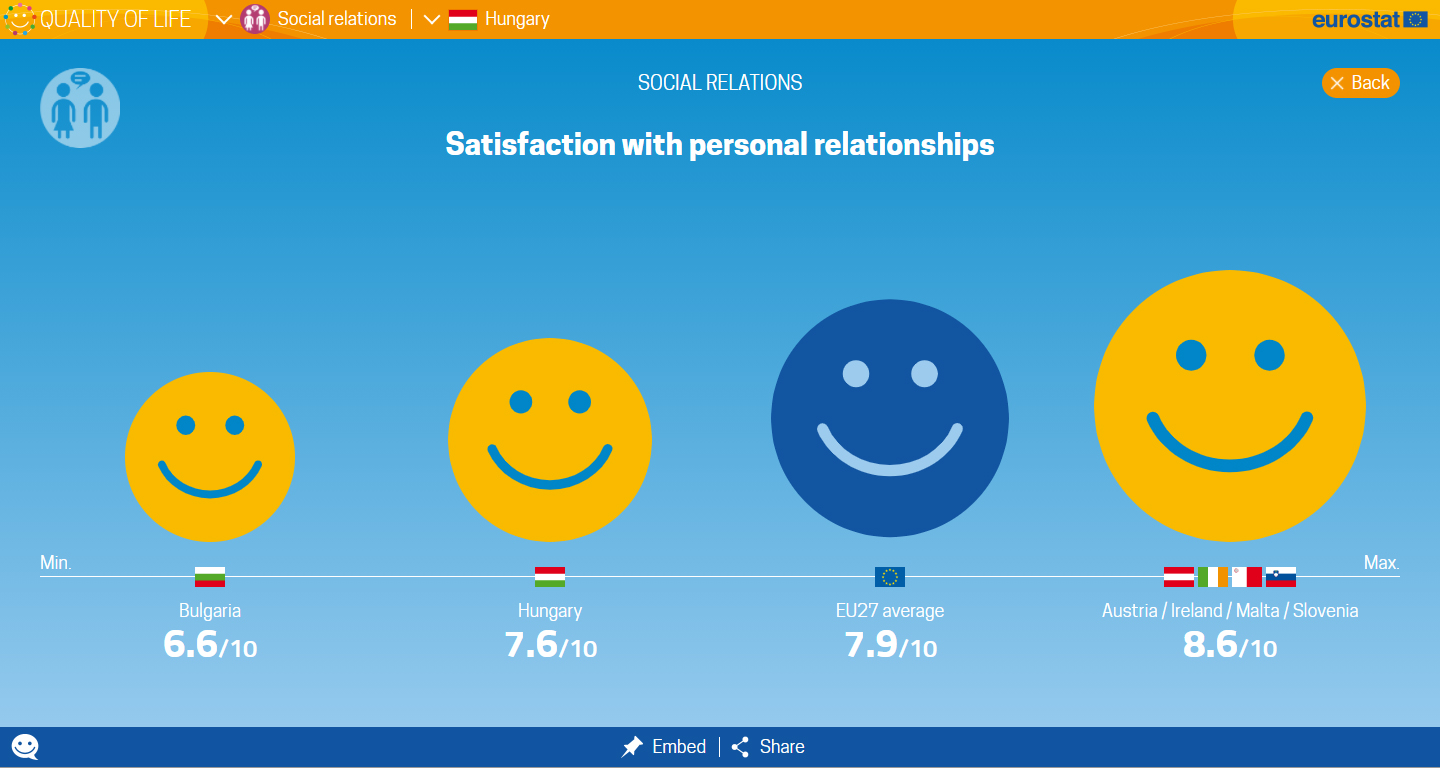
Let us consider an example of it. We want to analyze Hungarians’ satisfaction with personal relationships. To do it, we use Quality of life visualization tools at the Eurostat website (Fig. 1).
Figure 1.
Hungarians’ satisfaction with personal relationships. Source: https://ec.europa.eu/eurostat/cache/infographs/qol/index_en.html, accessed: 6 May 2021.
If we are not in a computer lab, we can show and examine this chart only, but in a computer lab we suggest using this online tool to examine the question, because in this case meta information and descriptions are also available from the application to answer critical questions. This example can emphasize the importance of using metainformation, descriptions.
We ask students to study this chart in small groups based on the listed questions. What kind of critical questions and comments arise in the students’ minds?
• We selected Hungary only. What is the reason for seeing Bulgaria, Austria, Ireland, Malta, Slovenia? Whether these countries have the smallest and highest value of data? Because it is not evident if we compare the positions of these countries to the min. and max. notes’ positions.
• What happens if the selected country is Bulgaria or Austria? Can we see 3 or 4 smiles? (The situation is not handled in the same way). In this case the min-max notes’ positions also not evident.
• What is illustrated on the chart? Was it a ten grades scale and does the chart shows the national averages on that scale? Or does it mean that for instance 7.6 of 10 Hungarians are satisfied with their personal relationships on average? Or 76% of Hungarians are satisfied with their personal relationships?
• What is the date of the data?
• Whether the horizontal axis is a scale or categorical axis? In the first case, the positions of the values are not correct on the chart?
• The areas of the different smiles are not proportionated to the value of the data. Furthermore, if we select Austria, we can see four smiles and two different sized smiles for Austria, so for one data at the same time. So it means this visualization uses four different constant sized smiles.
After the analysis, we can ask students to give similar examples on different visualizations, different misused figures they may have seen in everyday life if they can. This step represents the application of the acquired knowledge and provides some sort of feedback to the professor about that the students really understood what he tried to teach them. At the end of the class the educator summarizes the essence of the lesson and draws attention to that figures must always be examined critically and with an objective eye. In addition, the list of the questions is also repeated that must always come to mind whenever they see a figure: to whom, why, how, and for what purpose the illustration was prepared. These questions also can be understood as a kind of habit of mind (HOM) that need to master to think critically. This trio essentially corresponds to Curcio’s [88] different levels of interpretations about figures: Reading the data reading between the data, and reading beyond the data.
3.4Using the flipped classroom approach
In this section, we introduce two examples where official statistics takes place in the curriculum and flipped classroom approach was applied as well.
3.4.1Example 1
The first example comes from a statistics course called Economic and social statistics from 2020 spring (master level, international economics, and business field, taught in English). This course had 42 students and consisted of two parts: there was a large class lecture and there were two small groups (
At the beginning of the spring semester, in February 2020, we started holding traditional classes in the frame of lectures and seminars as well. However, this approach has changed due to the COVID-19. After March 2020, the lecture part was given to the students in the form of written materials and reading lessons, and the seminar part was turned into a flipped class. Lectures were not following a flipped approach then; materials were shared with the students in advance, and they were only provided with online consultation opportunities to ask their questions about what they read but were not given online presentations or video materials. This resulted in the loss of motivation by the students. They reported not enjoying this form of teaching. Even with the help of instructors, the topic of official statistics was quite difficult for them to comprehend. Alone they had an even harder time coping with the materials. Therefore, learning from the mistakes of the previous academic year, by the spring semester of 2021 we decided to transform the lecture to an online stream format, where the lecturer presented the essential notions in every topic live and the previously used extensive reading materials were also shared with the students to support their learning. They could follow the lecture and ask in realtime and recordings of the lectures were also shared with them so they could re-watch the videos anytime.
Therefore, the lecture even though it was slightly transformed to fit better the environment of the digital education we needed to switch to as a result of the outburst of the COVID-19 pandemic, was not following a switched approach. However, the seminar was transformed entirely in both the semesters of spring 2020 and spring 2021. In the upcoming part of this section we are going to focus on how the seminars worked and what was the feedback received from students. Flipping happened in two main steps: we prepared 1) pre-recorded videos and they were given to the students about each topic weekly (pre-class/asynchronous activities); and 2) there were weekly consultations about the same topics in online (streamed) format (at that period, holding face-to-face classes were not allowed due to the pandemic).
At the beginning of the semester we discussed the usage of online official statistical databases, online visualization tools, basic usage of statistical software and descriptive statistics in the frame of traditional, face-to-face seminars. After we changed into a flipped format, the topics focused on using and interpreting statistical methods (bivariate linear regression analysis, multivariate linear regression analysis, nonlinear regression analysis, principal component analysis and cluster analysis). Therefore, our purpose with the videos was to teach 1) how to use a statistical method and 2) how to interpret its results. Eighteen videos were created by an instructor on five topics. The logic of video creation was based on tasks (one video
Since this was our first flipping experience and we had no chance of having a control (not flipped) group due to the obligatory online education form, we did not measure the effect of flipped classrooms on several variables listed in the literature earlier. We focused on gathering the first impressions of students via an openended question after they completed the course. Only 11 students shared their opinion concerning the videos: 10 are considered positive, 1 considered negative opinion. Among the positive opinions, one student found videos enjoyable, another one referred to the easiness of learning with the help of videos and five students referred both to the enjoyment and the helping role of videos in learning. One student thought that learning by videos was great and more efficient than traditional learning. However, two students missed face-to-face seminars: they evaluated the videos as highquality materials, but they liked face-to-face seminars at the beginning of the semesters and felt less motivation for learning in the online space. Finally, the negative feedback was rather a development proposal: one student noted that videos could include more examples.
Participating in online, live consultations was not compulsory; approximately ten students (out of 42) took part in each session. However, that group of students who participated in live consultations were very active, took part in discussions and asked many questions. Students also told us that they enjoyed consultations and those sessions were very helpful in their learning process. Based on all of these, it seems that it was worth creating pre-recorded videos and having online consultations in the frame of this course.
3.4.2Example 2
The second example comes from an introductory statistics course from 2020 autumn (bachelor level, business education field, in Hungarian, 2 hours lecture and 2 hours seminar weekly). This course had 514 students and consisted of two parts: there was a large class lecture and there were small group (
Before 2020, we used pre-recorded videos in the frame of seminars in this course: there was a practice occasion at the end of the semester the solution of which was given to the students in video format as well to ease the preparation for the seminar exam. However, this approach has changed due to the COVID-19. From the beginning of the autumn semester (September 2020), the lecture part was held in a fully online (YouTube live stream) format without using any pre-lecture materials. Teaching materials (e.g. slides, learning guide, exercises) were uploaded weekly. Students could re-watch the lecture anytime. Seminar materials such as videos, learning guides, exercises, sample solutions were shared following the lecture. Students could work on it individually at home and they could discuss it during online seminar consultations, so the seminar part was the flipped class, where 1) pre-recorded videos were prepared and given to the students about each topic weekly (pre-class/asynchronous activities); and 2) there were weekly consultations about the same topics in online (streamed) and face-to-face format as well (in-class/synchronous activities). However, as the 3rd wave of COVID-19 has strengthened in Hungary (from November 2020), we could hold in-class activities only in the online format. The videos focused on solving tasks in the frame of seminars by using an online statistical database or by using Microsoft Excel. The purpose of the videos was to teach 1) how to use the database or software and 2) how to interpret the result. Forty-five videos were created by four instructors on 12 topics. The logic of video creation was based on tasks (one video
In the frame of the lecture students had to take a written or oral exam (it was optional due to the COVID-19 situation) where there were some short, theoretical questions and 2–4 calculation tasks (with interpretations) to be solved. Besides the exam, students had to accomplish a creative task: the idea comes from the European Statistics Competition (ESC). Students created a maximum 2-minute-long video about the issues of nowadays university students. They could work in small groups of a maximum group size of 4. Under this topic, students could choose one or more problems. The purpose of the video was to call citizens’ attention to the discussed problem(s). In the video, it was necessary to stress the importance and the topicality of the issue, with the help of data, visualization, statistical analysis, conclusions, their selected topic, and results had to be analysed correctly and creatively at the same time. The video must have had a message. In the video, they had to fit the communication to the purpose of the video, so it must have been understandable for any ordinary citizen. Students had to prepare a video and a short description of the video, which contained the name of team members, the main message(s) of the video, sources of data and visualizations, used documents, definitions, descriptions of used statistical indicators, background tables (calculations, Excel outputs), name of used software. The aspects of the evaluation were: the content of the description (information and professional contents): 10 points, the professional content of the video (correctness of the conclusions, use of statistical techniques and data sources): 15 points, the creativity of the video: 5 points. Most of the students analysed the effects of the pandemic on their social relations, how they lost motivation to study online, and the challenges of online learning and life.
In the frame of the seminar, students had to take a computer-based exam, where they had to solve tasks by using Microsoft Excel for calculations, table and chart creation and they also had to interpret results.
Since this was our first flipping experience during this entire introductory statistics course and we had no chance of having a control (not flipped) group due to the obligatory online education form, we did not measure the effect of flipped classrooms on several variables listed in the literature earlier. We focused on gathering the first impressions of students via an open-ended question after they completed the course. Only 17 students shared their opinion concerning the videos of which ten are considered positive, and seven considered negative. Among the positive opinions, five students mentioned that learning based on videos is very flexible (videos can be stopped and replayed anytime). One student pointed out besides flexibility that the videos were organized based on topics in a playlist; therefore it was easy to search for a topic but watch them continuously as well. One student liked the creation logic of videos (one task
Only a small portion (about 2% of students) participated in face-to-face classes. This low ratio can have several reasons. First, participation was not compulsory due to the COVID-19 situation. Second, there was an online consultation each week where students could participate (an additional 4% joined online consultations). Third, online consultations were recorded and shared with students; and perhaps they felt motivation only in re-watching consultations (due to the COVID-19 situation) instead of participating in them. By watching the recorded consultations, students lost the possibility of having a real-time consultation, but they were given the opportunity to re-watching consultations anytime. Nevertheless, that small portion of students who participated in face-to-face classes was active, enjoyed the activities and told us that consultations were beneficial in their learning process.
Although we had a limited number of feedbacks from videos and in-class activities from both of the examples, yet some conclusions can be drawn. The positive feedbacks confirm that the created videos were meant to be helpful tools in student’s learning; and the negative opinions point out possible directions for further improvements (especially at the BSc level, for example improving the quality of videos, using more detailed titles, splitting the longer videos into smaller parts). It seems that master students were more satisfied with videos and were more motivated to participate in live consultations. However, far-reaching conclusions cannot be drawn because of the different types of courses and the different people of instructors. However, based on feedback about live consultations, it is worth including several activities in them; however, low participation rate (especially at the BSc level) is a challenge in the current situation. Perhaps, if the consultations are going to be held entirely in a face-to-face format in the future (as it was suggested by some MSc students), the participation rate would be higher.
3.5Voting systems in action
In addition to the earlier mentioned various teaching methods, we also implemented gamification, especially voting systems in our classes. We used this method in introductory statistics classes in two different ways before the COVID-19 pandemic. One of these was using quizzes at the end of the seminars to see how much attention the students paid to the educational material of the seminar. We used the earlier described quiz software, Kahoot. Our aim with implementing Kahoot was to make students come to the classes, take an active role, pay attention to the material, and enjoy themselves. As a motivation the students who got any of the first three places out of the classes of 30 people could earn additional points which had been counted to their final exam at the end of the semester. There were occasions when we gave one point to everybody who had been there and finished the test. Our goal was not only to motivate them to study and to come to classes but also to show them realworld tasks during these tests and reflect on those areas in which they should improve to get excellent results. We tried to avoid the disadvantages of gamification. That is why we did not have a test at the end of every seminar. Students never knew when we were going to test their knowledge, which made them focused and ready all the time since they did not have many chances to collect additional points. Based on our experience this was a very good idea to implement Kahoot and quizzes into the statistics seminars, and students also enjoyed it a lot. We reach the goals we aimed at with the use of this gamification tool. However, we can say that at least in the case of statistics education it can be only a complementary tool, but a whole course cannot be built on gamification this way.
The other application we used in statistics teaching was VoxVote which is also a quiz app, but we used it differently from Kahoot. VoxVote voting was applied in statistics lectures, not seminars. When using the app we had different goals. At the beginning of the semester we used it as an icebreaker. We asked the students in open questions about what they expect about the course and what comes to their minds when they think about statistics. Later VoxVote was used for educational and attitude-forming purposes. Through examples of provoking questions and graphs we tried to show them the misuse of statistics and emphasize how important it is to understand and be able to interpret graphs and data tables. We also wanted to highlight that the media and internet sometimes try to distort the data and the related information. To do so, we used examples from Gapminder Test 2017. Our aim with this was to hand over students the message that people tend to think that global phenomena like poverty, education or gender inequality are getting worse and worse. However, we never think about the fact, that on the one hand all the data from around the world are available for us now, which was not true in the previous decades. It means that it is hard to compare the situation to earlier ages. On the other hand media has a distorting effect on our thinking and the way how the messages it broadcasts are formulated matters a lot. If we are aware of these, we should not accept everything we hear as a fact but using critical thinking instead because poverty is lower than before, education is improving all around the world and we have never been this close to gender equality. Although during the lectures we did not utilize the gamification functions of this application we considered the usage of VoxVote successful. We reached our aims of ice-breaking and attitude formation and we could involve students more in the classes.
4.Summary
Nowadays the importance of statistics and statistics education is higher than it has ever been before. Everybody needs statistical, data and visual literacy to produce, use, or read data and visualizations. Of course the required level of these literacies differs individually. Different statistics courses have to focus not only on the expected outcomes of the training program but also on developing literacies, statistical thinking, and the correct use of statistics. The theoretical knowledge is not enough; practical knowledge and knowledgeable application of statistics are required. To reach these requirements, using real-life problems, modern technologies such as databases, (online) analytical and visualization tools is crucial, which means that the review of the curricula and keeping up with new technologies are suggested. Educators have to develop not only the statistical and technical knowledge but also their pedagogical methodologies repertoire. Several papers show that the use of real problems, technology, and active teaching methods, in which students are involved actively, are more efficient than the traditional lecturebased frontal teaching method. In this study, we demonstrated some activitybased teaching and learning methods, such as problem-based learning, project-based learning, thinking-based learning, gamification, flipped classroom and combinative use of these methods, which can be used in a part of a class, in a whole lesson or during the whole semester. Students prefer the active teaching methods over traditional lectures and seminars, and they can obtain more practical and applicable knowledge. The advantages of these methods are not only that the analytical skills, but also the way of thinking and other soft skills such as teamwork, communication skills, creativity can be developed. Students can learn not only from the teachers but also from the activities and the group work and cooperation between students. In the active learning and teaching methods, exercises, examples are very important. The role of educators differs from the lecturebased approach: it means more of a facilitator and moderator role rather than an instructor role. The results and the activities also depend on the group and individual activities; thus active teaching and learning methods require more planning in advance. We have to tailor the methods to the students, to the topics and the goals of the course. The activities, teaching and learning forms, examples, potential pitfalls have to be thought over before the class, causing more activities for educators.
Because of the Covid-19 pandemic more and more online materials, teaching methods were used during the last one and a half years. Our experiences show that students like online video materials, but these can more complement rather than substitute face-to-face education. The reason for the popularity of the online materials is that they can replay these videos several times and as well that they can help to understand concepts at their own pace better. However, on the other hand, without personal interaction both teachers and students lose their teaching and learning motivation and require more effort to understand several things. The success of active learning also depends on both the educators’ and the students’ time expenditure and attitude. From the point of view of the results and outcomes, we think it is worth paying more attention to students and active teaching and learning methods, which can be used at the school level, higher educations, adult education also.
References
[1] | Ridgway J. Implications of the data revolution for statistics education. International Statistical Review. (2016) ; 84: (3): 528-549. |
[2] | Zieffler A, Garfield J, Fry E. What is statistics education? in International Handbook of Research in Statistics Education (ed by Ben-Zvi D, Makar K, Garfield J), Springer. (2018) ; 37-70. |
[3] | GAISE College Report ASA Revision Committee. Guidelines for Assessment and Instruction in Statistics Education College Report 2016. http://www.amstat.org/education/gaise. |
[4] | Kovacs P. ProCivicStat: Statistics pro civic engagement, ISLP Newsletter. April (2018) ; 101: : 19. |
[5] | Schiller A, Engel, J. The importance of statistical literacy for democracy – civic-education through statistics. In Challenges and Innovations in Statistics Education (ed by Kovács P). Multiplier Conference of PROCIVICSTAT: Szeged (Hungary), September 7–9; (2017) . Conference Proceedings. 2017; 5p. |
[6] | Kovács P, Kazár K, Kuruczleki, É. Using visualization tools in classes. in Challenges and Innovations in Statistics Education (ed by Kovács P). Multiplier Conference of PROCIVICSTAT: Szeged (Hungary), September 7–9; (2017) . Conference Proceedings. 2017; 5p. |
[7] | Biehler R, Frischemeier D, Podworny S. Civic Engagement in Higher Education: A university course in civic statistics for mathematics preservice teachers. Zeitschrift für Hochschulentwicklung. (2018) ; 13: (2): 169-182. |
[8] | Ridgway R, Nicholson J, Gal I, Ridgway J. Understanding statistics about society: A brief framework of knowledge and skills needed to engage with civic statistics. A product of the ProCivicStat project. Retrieved [April 2020]; from http//IASEweb.org/ISLP/PCS. |
[9] | Engel J. Statistical literacy and society. What is civic statistics? in Actas del Tercer Congreso International Virtual de Educación Estadística (ed by Contreras JM, Gea MM, López-Martín, MM, Molina-Portillo E.) Granada: Grupo de Investigación de Educación Estadística. (2019) ; 1-17. |
[10] | ProCivicStat Partners. Engaging Civic Statistics: A call for action and recommendations. A product of the ProCivicStat project. (2018) ; Accessed 28 April 2021 from http//iase-web.org/islp/pcs. |
[11] | Ben-Zvi D, Gravemeijer K, Ainley J. Design of statistics learning environments. In International Handbook of Research in Statistics Education (ed by Ben-Zvi D, Makar K, Garfield J), Springer. (2018) ; 473-502. |
[12] | Duch BJ, Groh SE, Allen DE (eds.). The power of problem-based learning. Sterling, VA: Stylus. (2001) . |
[13] | de Graaf E, Kolmos A. History of problem-based and project-based learning. In Management of change (ed by de Graaf E, Kolmos A). Sense Publishers, Rotterdam/Taiwan, (2009) ; 1-8. |
[14] | Kilroy DA. Problem based learning. Emergency medicine journal. (2004) ; 21: (4): 411-413. |
[15] | Hung W, Jonassen DH, Liu R. Problem-based learning. Handbook of Research on Educational Communications and Technology. (2008) ; 3: (1): 485-506. |
[16] | Allen DE, Donham RS, Bernhardt SA. Problem-based learning. New Directions for Teaching and Learning. (2011) (128): 21-29. |
[17] | de Graaf E, Kolmos A. Characteristics of problem-based learning. International Journal of Engineering Education. (2003) ; 19: (5): 657-662. |
[18] | Savin-Baden M. Problem-based learning in higher education: Untold stories. McGraw-Hill Education (UK). (2009) . |
[19] | Budé L, Imbos T, vd Wiel MW, Broers NJ, Berger MP. The effect of directive tutor guidance in problem-based learning of statistics on students’ perceptions and achievement. Higher Education. (2009) ; 57: (1): 23-36. |
[20] | Karpiak CP. Assessment of Problem-Based Learning in the Undergraduate Statistics Course. Teaching of Psychology. (2011) ; 38: (4): 251-254. doi: 10.1177/0098628311421322. |
[21] | Kurniawan DA, Perdana R. Investigation of problem based learning: process of understanding the concepts and independence learning on research statistics subject. Humanities & Social Sciences Reviews. (2019) ; 7: (5): 1-11. |
[22] | Tarmizi RA, Bayat S. Effects of problem-based learning approach in learning of statistics among university students. Procedia-Social and Behavioral Sciences. (2010) ; 8: : 384-392. |
[23] | De Jong N, Verstegen DML, Tan FES, O’Connor SJ. A comparison of classroom and online asynchronous problem-based learning for students undertaking statistics training as part of a Public Health Masters degree. Advances in Health Sciences Education. (2013) ; 18: (2): 245-264. |
[24] | Bland JM. Teaching statistics to medical students using problem-based learning: the Australian experience. BMC Medical Education. (2004) ; 4: (1): 1-5. |
[25] | Savin-Baden M. Challenging Models and Perspectives of Problem-Based Learning. in Management of change (ed by de Graaf E, Kolmos A). Sense Publishers, Rotterdam/Taiwan. (2009) ; 9-30. |
[26] | Bell S. Project-based learning for the 21st century: Skills for the future. The Clearing House. (2010) ; 83: (2): 39-43. |
[27] | Kokotsaki D, Menzies V, Wiggins A. Project-based learning: A review of the literature. Improving schools. (2016) ; 19: (3): 267-277. |
[28] | Krajcik J, Blumenfeld P. Project-Based Learning. In The Cambridge Handbook of the Learning Sciences (ed by Sawyer R). Cambridge: Cambridge University Press. (2005) ; 317-334. |
[29] | Moreira da Silva MP, Pinto SS. Teaching statistics through learning projects. SERJ. (2014) ; 13: (2): 177-186. |
[30] | Spence DJ, Bailey B, Sharp JL. The impact of student-directed projects in introductory statistics. SERJ. (2017) ; 16: (1): 240-261. |
[31] | Awuah R, Gallagher KM, Dierker LC. Taking project-based statistics abroad: learning experiences and outcomes of a project-based statistics course in West Africa. SERJ. (2020) ; 19: (3): 18-31. |
[32] | Donoghue T, Voytek B, Ellis SE. Teaching creative and practical data science at scale. Journal of Statistics and Data Science Education. (2021) ; 29: (S1): S27-S39. |
[33] | Birrell CL. Teaching sample survey design – a project using a virtual population. Journal of Statistics Education. (2020) ; 28: (2): 165-174. |
[34] | Hudiburgh LM, Garbinsky D. Data Visualization: Bringing Data to Life in an Introductory Statistics Course. Journal of Statistics Education. (2020) ; 28: (3): 262-279. |
[35] | Lawton S, Taylor L. Student perceptions of engagement in an introductory statistics course. Journal of Statistics Education. (2020) ; 28: (1): 45-55. |
[36] | Swartz RJ. Energizing learning. Educational Leadership. (2008) ; 65: (5): 26-31. |
[37] | Salih M. Teachers’ perceptions and students’ motivation to Thinking-based Learning (TBL) in a classroom context. Journal of Research, Policy & Practice of Teachers & Teacher Education. (2014) ; 4: (2): 5-14. |
[38] | Torrecilla JS. Thinking-based learning at higher education levels: Implementation and outcomes within a chemical engineering class. (2021) ; 98: (3): 774-781. doi: 10.1021/acs.jchemed.0c00283. |
[39] | Tajudin NM, Zamzamir Z, Othman R. A Thinking-Based Learning Module for Enhancing 21st Century Skills. International Journal of Innovative Technology and Exploring Engineering. (2019) ; 8: (6): 397-401. doi: 10.35940/ijitee.F1080.0486S419. |
[40] | Hashim H, Norawi Ali M, Ali Shamsudin M. Infusing High Order Thinking Skills (HOTs) through Thinking Based Learning (TBL) during ECA to enhance students interest in STEM. International Journal of Academic Research in Business and Social Sciences. (2017) ; 7: (11): 1191-1199. doi: 10.6007/IJARBSS/v7-i11/3557. |
[41] | Hixson NK, Ravitz J, Whisman A. Extended professional development in project-based learning. Impacts on 21st Century Teaching and Student Achievement. Charleston, WV: West Virginia Department of Education, Division of Teaching and Learning, Office of Research; (2012) . https//eric.ed.gov/?id=ED565466. |
[42] | Alwehaibi HU. Novel program to promote critical thinking among higher education students: Empirical study from Saudi Arabia. Asian Social Science. (2012) ; 8: (11): 193-204. doi: 10.5539/ass.v8n11p193. |
[43] | Bailin S. Critical and creative thinking. Informal Logic. (1987) ; 9: (1): 23-30. doi: 10.22329/il.v9i1.2656. |
[44] | Swartz R, McGuinness C. Developing and assessing thinking skills. The International Baccalau The International Baccalaureate Project. Final Report Part 2: Evaluation of Current IB Programmes; (2014) . doi: 10.13140/RG.2.1.3082.6080. |
[45] | Costa AL, Kallick B. Habits of Mind Across the Curriculum: practical and creative strategies for teachers. Association for Supervision and Curriculum Development (ASCD); (2009) . |
[46] | Livingstone JA. Metacognition: An Overview. (2003) ; https//eric.ed.gov/?id=ED474273. |
[47] | Swartz R, McGuinness C. Developing and Assessing Thinking Skills: Final Report Part 1, Literature Review and Evaluation Framework; (2014) . doi: 10.13140/RG.2.1.4917.6163. |
[48] | Farmus L, Cribbie RA, Rotondi MA. The flipped classroom in introductory statistics: Early evidence from a systematic review and meta-analysis. Journal of Statistics Education. (2020) ; 28: (3): 316-325. |
[49] | Ash K. Educators view flipped model with a more critical eye. Education Week, (2012) ; S6-S7. |
[50] | Stone, BB. Flip Your Classroom to Increase Active Learning and Student Engagement in Proceedings From 28th Annual Conference on Distance Teaching & Learning, Madison, WI, USA. (2012) ; [cited 2021 May 5] Available from https//cn.polyvision.com/24/_moodle_ruhr-uni-bochum_de/m/pluginfile.php/278895/mod_resource/content/3/ICM_Effects%20of%20Active%20learning%20strategies%20and%20student%20feedback.pdf. |
[51] | Tang T, Abuhmaid AM, Olaimat M, Oudat DM, Maged A, Bamanger E. Efficiency of flipped classroom with online-based teaching under COVID-19, 2020 Interactive Learning Environments, Published online: 2020 Sept 13. doi: 10.1080/10494820.2020.1817761. |
[52] | Telles-Langdon DM. Transitioning University Courses Online in Response to COVID-19. Journal of Teaching and Learning. (2020) ; 14: (1): 108-119. |
[53] | O’ Flaherty J, Phillips C. The use of flipped classrooms in higher education: A scoping review. Internet and Higher Education. (2012) ; 25: (April): 85-95. |
[54] | Machemer P, Crawford P. Student perceptions of active learning in a large cross disciplinary classroom. Active Learning in Higher Education. (2007) ; 8: (1): 19-30. |
[55] | Peterson DJ. The flipped classroom improves student achievement and course satisfaction in a statistics course: A quasi-experimental study. Teaching of Psychology. (2016) ; 43: (1): 10-15. |
[56] | Burke AS, Fedorek B. Does “flipping” promote engagement? A comparison of a traditional, online, and flipped class. Active Learning in Higher Education. (2017) ; 18: (1): 11-24. |
[57] | Gundlach E, Richards KAR, Nelson D, Levesque-Bristol C. A Comparison of Student Attitudes, Statistical Reasoning, Performance, and Perceptions for Web-Augmented Traditional, Fully Online, and Flipped Sections of a Statistical Literacy Class. Journal of Statistics Education. (2015) ; 23: (1): 1-33. |
[58] | Nielsen PL, Bean NW, Larsen RAA. The impact of a flipped classroom model of learning on a large undergraduate statistics class. Statistics Education Research Journal. (2018) ; 17: (1): 121-140. |
[59] | Wilson SG. The flipped class: A method to address the challenges of an undergraduate statistics course. Teaching of Psychology. (2013) ; 40: (3): 193-199. |
[60] | Burgoyne S, Eaton J. The Partially Flipped Classroom: The Effects of Flipping a Module on “Junk Science” in a Large Methods Course. Teaching of Psychology. (2018) ; 45: (2): 154-157. |
[61] | Winquist JR, Carlson KA. Flipped statistics class results: better performance than lecture over one year later. Journal of Statistics Education. (2014) ; 22: (3): 1-10. |
[62] | McLaughlin JE, Kang I. A flipped classroom model for a biostatistics short course. Statistics Education Research Journal. (2017) ; 16: (2): 441-453. |
[63] | Shinaberger L. Components of a flipped classroom influencing student success in an undergraduate business statistics course. Journal of Statistics Education. (2017) ; 25: (3): 122-130. |
[64] | Rigóczki CS. Gamifikáció (játékosítás) és pedagógia. Új Pedagógiai Szemle. (2016) ; (3-4): 69-75. |
[65] | Helgason D. 2010 Trends – Unity Blog. 2010. Retrieved May 4, 2021, from https//blogs.unity3d.com/2010/01/14/2010-trends/. |
[66] | Zichermann G. A Long Engagement and a Shotgun Wedding: Why Engagement is the Power. 2011, Retrieved May 4, 2021, from https//www.slideshare.net/gzicherm/g-summit-opener. |
[67] | Terill B. My Coverage of Lobby of the Social Gaming Summit. 2008. Retrieved May 4, 2021, from http//www.bretterrill.com/2008/06/mycoverage-of-lobby-of-social-gaming.html. |
[68] | Kéri A. Developing a customizable serious game and its applicability in the classroom. World Academy of Science, Engineering and Technology International Journal of Educational and Pedagogical Sciences. (2019) ; 13: (5): 553-560. |
[69] | Kapp KM. The gamification of learning and instruction: game-based methods and strategies for training and education. New Yersey: John Wiley & Sons Inc.; (2012) . |
[70] | Faragó B. Tanulói aktivitás, aktív tanulás és tevékenység online környezetben. In: Lévai D, Papp-Danka A, editors. Interaktív oktatásinformatika. Eger: ELTE Eötvös Kiadó; (2015) ; 19-33. |
[71] | Furdu I, Tomozei C, Köse U. Pros and cons gamification and gaming in classroom. Broad Research in Artificial Intelligence and Neuroscience. (2017) ; 8: (2): 56-62. |
[72] | Fromann R. Gamification – betekintés a netgeneráció-kompatibilis, játékos motivációk világába. Oktatás-informatika. (2014) ; (1): 60-69. |
[73] | Lee JJ, Hammer J. Gamification in Education: What, How, Why Bother? Academic Exchange Quarterly. (2011) ; 15: (2): 2. |
[74] | Csikósné Maczó E. A gamifikáció felsőoktatási alkalmazásának lehetőségei. Képzés és gyakorlat. (2019) ; 17: (3-4): 24-32. doi: 10.17165/TP.2019.3-4.2. |
[75] | Nicholson S. A RECIPE for Meaningful Gamification. In: Reiners T, Wood LC, editors. Gamification in Education and business. Switzerland: Springer International Publishing; (2015) ; 1-20. doi: 10.1007/978-3-319-10208-5_1. |
[76] | Hamari J, Koivisto J, Sarsa H. Does Gamification Work? – A Literature Review of Empirical Studies on Gamification. 47th Hawaii International Conference on System Science. (2014) ; pp. 3025-3034. doi: 10.1109/HICSS.2014.377. |
[77] | Bellotti F, Berta R, De Gloria A. Designing effective serious games: opportunities and challenges for research. International Journal of Emerging Technologies in Learning (iJET) (2010) ; 5: (3): 22-35. doi: 10.3991/ijet.v5s3.1500. |
[78] | Squire K. From Content to Context: Videogames as Designed Experience. Educational Researcher. (2006) ; 35: (8): 19-29. doi: 10.3102/0013189X035008019. |
[79] | Ford T. 4 Pros and Cons of Gamified Learning. 2015. Retrieved May 6, 2021, from https//tophat.com/blog/gamified-learning/. |
[80] | Laster J. At Indiana U., a class on game design has students playing to win. The Chronicle of Higher Education. 2010: Retrieved from https//www.chronicle.com/blogs/wiredcampus/at-indiana-u-a-class-on-game-design-has-students-playing-to-win. |
[81] | Kennette LN, Beechler MP. Gamifying the classroom: Tips from the trenches. Transformative Dialogues: Teaching & Learning Journal. (2019) ; 12: (2): 1-8. |
[82] | Kovács P, Kazár K, Kuruczleki É. Social and economic networks and financial literacy in statistics classes: lessons and experiences. In Looking back, looking forward. Proceedingsof the Tenth International Conference on Teaching Statistics (ICOTS10, July, 2018), Kyoto, Japan (ed by In Sorto MA, White A, Guyot L). Voorburg, The Netherlands: International Statistical Institute. (2018) ; 4p. |
[83] | Planinic M, Ivanjek L, Susac A, Milin-Sipus Z. Comparison of university students’ understanding of graphs in different contexts. Physical Review Special Topics – Physics Education Research. (2013) ; 9: (2): 1-9. doi: 10.1103/PhysRevSTPER.9.020103. |
[84] | Aparicio M, Costa CJ. Data visualization. Communication Design Quarterly Review. (2015) ; 3: (1): 7-11. doi: 10.1145/2721882.2721883. |
[85] | Ryan L, Silver D, Laramee R, Ebert D. Teaching data visualization as a skill. IEEE Computer Graphics and Applications. (2019) ; 39: (2): 95-103. doi: 10.1109/MCG.2018.2889526. |
[86] | Wiles AM. Figure analysis: A teaching technique to promote visual literacy and active learning. Biochemistry and Molecular Biology Education. (2016) ; 44: (4): 336-344. doi: 10.1002/bmb.20953. |
[87] | Mayer RE. The promise of multimedia learning: using the same instructional design methods across different media. Learning and Instruction. (2003) ; 13: (2): 125-139. doi: 10.1016/S0959-4752(02)00016-6. |
[88] | Curcio FR. Comprehension of mathematical relationships expressed in graphs. Journal for Research in Mathematics Education. (1987) ; 18: (5): 382-393. doi: 10.2307/749086. |

