
Risk of Collusion: Will Groups of 3 Ruin the FIFA World Cup?
Abstract
In 2026, the FIFA World Cup will for the first time gather 48 men’s national teams. It will consist of a group stage made of 16 groups of three, with the best two teams in each group advancing to the knockout stage. Using groups of three raises several fairness issues, including the risk of match fixing and schedule imbalance. In this article we examine the risk of collusion. The two teams who play the last game in the group know exactly what results will let them advance to the knockout stage. Risk of match fixing occurs when a result qualifies both of them at the expense of the third team of the group, and can seriously tarnish the tournament. We quantify how often this is expected to happen and explain how to build the match schedule so as to minimize the risk of collusion. We also quantify how the risk of collusion depends on competitive balance. Moreover, we show that forbidding draws during the group stage (a rule considered by FIFA) does not eliminate the risk of match fixing, and that, surprisingly, the 3-2-1-0 point system does not do a better job at decreasing the risk of collusion than the 3-0 point system. Finally we describe alternate formats for a 48-team World Cup that would eliminate or strongly decrease the risk of collusion.
1Introduction
The soccer World Cup is the most popular sporting event in the world together with the Olympic Games (Wikipedia, 2018). It is organized every four years by FIFA (Fédération Internationale de Football Association), the sport’s world governing body. Since 1998, 32 senior men’s national teams participate in the final tournament, based on their results in the two-year qualification process—except for the host nation(s), who automatically qualify. First, the 32 teams are divided into eight groups of four; each group plays a single round-robin tournament. Then the best two teams in each group advance to the knockout stage, starting with the round of 16.
On January 10, 2017, the FIFA council unanimously decided that starting with the 2026 edition, 48 teams will qualify to the World Cup finals. Interestingly, the press release by FIFA (2017) does not motivate the decision. However, according to The New York Times (2017), the decision to expand was both political and financial: “FIFA’s president, Gianni Infantino, had pressed for the change when he ran for the presidency [in 2016], as a way to invigorate the event and to include more countries. Expansion is sure to be popular in the vote-rich confederations of Africa and Asia that serve as any FIFA president’s power base. And few dispute that a 48-team World Cup would be a bigger, richer tournament, producing, by FIFA’s estimates, an additional $1 billion in television, sponsorship and ticketing revenue in the first cycle alone.”
On the same day, FIFA decided that the final tournament will still consist of a group stage followed by a knockout stage, but that the group stage will use 16 groups of three instead of the traditional groups of four that have been continuously used since 1950.1 Like in the current format, each group will play a single round-robin tournament, and the winner and runner-up will advance to the knockout stage, which will now start with the round of 32.
Using groups of three may look harmless, but it actually raises several fairness issues. The first obvious issue is schedule imbalance. Let us denote by A the team that will play the first two group games, B the team that will play the first and last group matches, and C the remaining team, which will play the last two group games (see Table 1). Team B will enjoy more rest days between their two group matches than Teams A and C; Team A, if they advance to the knockout round, will enjoy more rest days than the other advancing team; Team C will have none of these benefits.
Table 1
Match schedule of a group
| Match 1 | Match 2 | Match 3 |
| A–B | A–C | B–C |
A more serious issue is the subject of this article: the risk of match fixing (or collusion). As soon as Match 2 is finished (see Table 1), Teams B and C will know what results of Match 3 will let them advance to the knockout stage. Those teams may be tempted to collude when a result lets both of them advance, at the expense of Team A. Suspicion of collusion can badly harm the tournament and the reputation of soccer in general, whether the match is actually fixed or not, since outcome uncertainty is at the very root of sport’s popularity. Not all teams would collude if given the opportunity, but even suspicion of coordination could damage the World Cup by casting doubt on the sincerity of the outcome. When collusion does occur, it need not be explicitly agreed upon before the match. It may simply take the form of two teams satisfied with the current score more or less late in a game and refusing or doing little to attack each other.
The history of soccer is full of examples of such tacit coordination, including very recent ones. The “disgrace of Gijón” is certainly the most famous example of match fixing in the history of soccer; see, e.g., Kendall and Lenten (2017, Section 3.9.1). It refers to the match between West Germany and Austria who refused to attack each other during 80 minutes, satisfied by the 1-0 Germany win that would let both teams advance to the second round of the 1982 FIFA World Cup, at the expense of Algeria, who had played its last group game the day before. To prevent this to happen again, FIFA decided that all teams in a given group would play their last group match at the same time, which of course is not possible with groups that have an odd number of teams, in particular with groups of three.
Even in traditional groups of four, playing the last two group games at the exact same time does not fully prevent collusion. Denmark-France (0-0 on June 26, 2018 during the 2018 FIFA World Cup) is a recent example of tacit collusion in this context: both teams knew that a draw would let them advance to the knockout stage whatever the result of the other game in the group, Australia-Peru. They did little effort to attack each other, which resulted in a boring game and the only goalless match of the 2018 World Cup. The crowd made its displeasure known, as well as football fans around the world on social media (The Sun, 2018). Denmark’s manager Åge Hareide said after the game: “We just needed one point, we were up against one of the best teams in the world at counterattacks, so we would have been stupid to open up a lot of space. We stood back and got the result we needed, it was a 0-0 and we’re very pleased with that” (The Guardian, 2018).
The last 15 minutes of the 2018 World Cup match Japan-Poland provide another example of tacit collusion. Poland, already eliminated, was leading 1-0 and happy to leave the tournament on a win. When Senegal, which was playing at the same time against Colombia, conceded a goal at the 74th minute, Japan was perfectly even with Senegal in the group ranking on points, goal difference, and goals scored. The next tie-breaker was fair-play. With two yellow cards less than Senegal over the group stage, Japan would advance at the expense of Senegal. Even though Senegal could still score, Japan was happy with a 0-1 loss. Japan and Poland then suddenly stopped attacking each other, in scenes reminiscent of the disgrace of Gijón (BBC, 2018).
Peru and Colombia also colluded during the last minutes of their World Cup qualifying game (1-1) in October 2017. The current score saw both sides progress in World Cup qualifying. With results elsewhere going in their favor, Colombia knew a draw would see them finish in fourth place and qualify automatically, while Peru would advance to a play-off against New Zealand after finishing fifth. Both teams then refused to attack each other. The Independent (2017) has reported that, following allegations of match fixing, Radamel Falcao, the Colombian striker and captain, admitted that he discussed playing for a draw with his opponents, as could clearly be seen on TV.
Denmark-Sweden at UEFA Euro 2004 is another example of a tacit collusion situation (Kendall and Lenten, 2017, Section 3.9.3): a 2-2 tie would qualify both teams at the expense of Italy, whatever the result of Italy against Bulgaria. The game indeed ended as a 2-2 draw, and even though Sweden and Denmark seemed to attack each other without restraint and try to win the game, the Italian team and fans, among others, raised complaints and suspected match fixing.
Kendall and Lenten (2017) provide other examples of tacit collusion in sports, and more generally examples where the rules of sports have led to unforeseen and/or unwanted consequences. Csató (2018b) also investigates an example of tacit collusion in soccer where, weirdly, two teams playing against each other are strictly better off by not winning.
In this article, we quantify the risk of match fixing in groups of three, when two teams advance to the next phase. Section 2 describes the situations of possible collusion. In Section 3 we compute the probability of occurrence of those situations, first at the level of a group, then at the level of the tournament, which is made of 16 groups. Section 4 investigates the impact of the match schedule on the risk of collusion. In particular, we show that in order to minimize this risk, the team that plays the first two group games should be the a priori strongest team in the group. In Section 5 we measure the impact of competitive balance on the risk of collusion. Section 6 and 7 quantify by how much the risk of collusion would decrease if FIFA does not use the traditional 3-1-0 point system but adopts alternate point systems that forbid draws, the 3-0 and 3-2-1-0 point systems. Finally, we discuss our results in Section 8, before suggesting alternate formats for a 48-team World Cup in Section 9 that would decrease or even eliminate the risk of collusion. Section 10 concludes.
Note that two recent working papers by Chater et al. (2018) and Truta (2018) also conclude that, in order to maximize the number of competitive matches in groups of three, when two teams advance to the next phase, the a priori best team should be passive in the last round. While this article was being reviewed, Krumer, Megidish, and Sela (2019) argued that in the case of perfect competitive balance the team playing in the last two rounds has theoretically a higher probability of advancing, which reinforces the idea that the 2026 FIFA World Cup will violate fair-play principles. Note also that several approaches in the literature are connected to the subject of this article. For instance Adler et al. (2017), Annis and Wu (2006), Appleton (1995), Baumann, Matheson, and Howe (2010), Dagaev and Rudyak (2019), Edwards (1998), Glickmann (2008), Glickmann and Hennessy (2016), Goossens, Beliën, and Spieksma (2012), Lasek and Gagolewski (2018), Marchand (2002), McGarry and Schutz (1997), Ross and Ghamami (2008), Scarf, Yusof, and Bilbao (2009), and Scarf and Yusof (2011) assess and compare the efficacy of tournament designs, mainly via simulations. In particular, Glickman (2008) assumes only partial information about competitors’ relative rankings and develops Bayesian locally-optimal design of adaptive knockout tournaments to maximize the probability that the best team advances to the next round. Glickman and Hennessy (2016) have extended this approach in order to identify the overall best team in fixed knockout tournament brackets. Other utility functions are also considered. Scarf, Yusof, and Bilbao (2009) propose tournament metrics that can be used to measure the success of a sporting tournament, and describe how these metrics may be evaluated for a particular tournament design. This allows them to compare competing designs, such as round robin, pure knockout and hybrids of these designs. They use the UEFA Champions League (soccer) to illustrate their methodology, while Scarf and Yusof (2011) use the FIFA World Cup. Fair draws of round robin tournaments have been suggested and studied in Guyon (2014, 2015) and Laliena and López (2019). Incentive incompatibility or lack of strategy-proofness, i.e., the possibility that a team is strictly better off with a weaker performance, has been investigated in Csató (2018b, 2019c), Dagaev and Sonin (2018), and Vong (2017). Another recent line of research is concerned with fixing a knockout tournament (Aziz et al. 2014; Stanton and Vassilevska Williams, 2011; Vassilevska Williams, 2010; Vu, Altman, and Shoham, 2009).
2Situations of possible collusion
We use the notation of Table 1. In a group of three, where the best two teams advance to the next stage, match fixing is possible when it is known after Match 2 that there exists a result of Match 3 (B vs C) which lets both Teams B and C advance at the expense of Team A. We then say that there is a risk of match fixing. We assume that on paper teams have an incentive to finish first of the group. For instance, this happens when group winners play the runners-up of another group in the first round of the knockout stage, as it has been the case since the 1998 World Cup. FIFA is likely to continue to implement this rule.2 We say that the risk of match fixing is aggravated when Team B or C can win the group even after losing its last game. This win incentive could somewhat mitigate the risk of collusion. However, in practice, teams would rather secure qualification to the knockout round than take risks in order to win the group and perhaps lose and fail to advance (see Denmark’s manager quote in the introduction). In practice, it might even happen that teams prefer to finish second in the group rather to win it, in order to end up in a preferred half of the knockout bracket. For instance, this seemed to be the case of England and Belgium during the 2018 FIFA World Cup. They were playing against each other in the last round of the group stage, and the winner could face a more difficult path to the final (Brazil in quarterfinals and France in semifinals) than the loser (England lost against Belgium and faced Sweden and Croatia instead). In the case of France-Denmark, it was not clear either whether winning the group was much of an advantage: the group winner could possibly face twice World Cup winners Argentina, while the runner-up would very likely face Croatia (all this indeed happened).
We assume that, like for the most recent World Cups, wins are worth 3 points, draws 1 point, losses 0 points, and that ties in the ranking table of the group are decided using the following ordered criteria: (1) overall goal difference, (2) overall goals scored; for the purpose of this study we only need to consider the further criterion (3): if exactly two teams are still even after Criteria 1 and 2 are applied, the winner (if any) of the match between these two teams is ranked higher. Note that the use of head-to-head results, promoted by UEFA, has no effect in groups of three. However, suspicion of collusion on the match Denmark-Sweden (UEFA Euro 2004, see introduction) was made possible only by the latter rule.
The following proposition describes all the situations of possible collusion after Match 2. We denote by GDA the goal difference of Team A after Match 2. When A has one win and one loss, and GDA = 0, we denote by i the number of goals scored against A by the team that lost against A, and j the number of goals scored by A when it lost to the other team. For example, when A wins 1-0 against B and loses 2-1 against C, then i = 0 and j = 1.
Proposition 1. Risk of match fixing occurs exactly in the following cases:
1. Team A has one draw and one loss.
2. Team A has two draws.
3. Team A has one win and one loss and GDA ≤ 0.
Aggravated risk of match fixing occurs if and only if Team A has one win and one loss and
GDA < 0, or
GDA = 0 and i < j.
Proof. Let us review all the possible situations after Match 2:
1. Team A has two wins. Then Team A has 6 points and advances to the knockout stage. No match fixing can eliminate them.
2. Team A has one win and one draw. Then Team A has 4 points and advances to the knockout stage. No match fixing can eliminate them.
3. Team A has one win and one loss. Then several cases must be looked at depending on the goal difference GDA of Team A:
(a) GDA > 0: Team A has won against, say, B with a margin of m goals, and lost to C with a margin of n goals, with GDA = m-n > 0. If B does not win against C, then it does not advance to the next round. If B wins against C, let p be the goal margin of this win. Then A, B, and C all have 3 points, B and C have goal differences p-m and n-p, one of which is strictly smaller than m-n (indeed, if p-m ≥ m-n and n-p ≥ m-n then 2m-n ≤ p ≤ 2n-m so m ≤ n). The roles of B and C can of course be swapped. Eventually, no match fixing can eliminate A.
(b) GDA < 0: Team A has won against, say, B with a margin of m goals, and lost to C with a margin of n goals, with GDA = m-n < 0. If B wins m - 0 against C, then A, B, and C all have 3 points, B has goal difference 0, C has goal difference n-m > 0, both better than the goal difference of A, and the final group ranking is C > B > A. Therefore, by loosing m - 0 against B, C can eliminate A and still win the group. Again the roles of B and C can be swapped. Eventually, there is an aggravated risk of match fixing.
(c) GDA = 0: The situation is similar to the case GDA < 0. If B wins (m + k) - k against C with k large enough, then A, B, and C all have 3 points and goal difference 0, but B and C will finish ahead of A thanks to a larger number of goals scored. Let (m + i) - i be the score of A - B, and j - (m + j) be the score of A - C, with i, j ≥ 0. If i > j, B is ahead of C due to a larger number of goals scored. If i = j, then B and C are perfectly even on points, goal difference, and goals scored, so Criterion 3 applies and in this case too the final group ranking is B > C > A. Finally, if i < j, C finishes ahead of B due to a larger number of goals scored. Again the roles of B and C can be swapped. Therefore, when GDA = 0, there is always a risk of match fixing, and this risk is aggravated if and only if the team that lost against A scored strictly less goals against A than A scored when it lost to the other team.
4. Team A has two draws. Then if B and C draw k - k with k large enough, all teams will have 2 points, 0 goal difference, and B and C will eliminate A thanks to a larger number of goals scored. There is a risk of match fixing.
5. Team A has one draw and one loss. Then if B and C draw they will have 2 and 4 points and will eliminate A (1 point). There is a risk of match fixing.
6. Team A has two losses. Then Team A has zero point and is already eliminated. □
Remark 2. Note that the second case (Team A has one win and one draw) might lead to another weak form of collusion: Team A might have few incentives to win its second match after winning the first, which can be advantageous for Team C. This is especially probable if Team A is chosen to be the strongest team, which, as we will see in Section 4, will minimize the risk of collusion in the third match.
3Probability of possible collusion
Here we consider a simple model to estimate the probability of the situations of possible collusion. We assume that the result of Match 2 is independent of the result of Match 1. We denote by pXY the probability that Team X wins against Team Y (see Table 2) and by p<0 (resp. p0, p>0) the probability that Team A has negative (resp. null, positive) goal difference, i.e., GDA < 0 (resp. = 0, >0), given that Team A has one win and one loss in the group stage.3 With obvious notations, we decompose p0 into p0 = p0, i≥j + p0, i<j. For simplicity, we denote by
Table 2
Win probabilities: pXY is the probability that Team X wins against Team Y
| Win prob. | A | B | C |
| A | pAB | pAC | |
| B | pBA | pBC | |
| C | pCA | pCB |
Table 3
Summary of all the possible situations of Team A after Match 2, their probabilities, and whether they lead to a risk of match fixing (RMF) and an aggravated risk of match fixing (RMF*)
| Situation of Team A after Match 2 | Probability | RMF | RMF* |
| Two wins | pABpAC | ||
| One win and one draw | pABdAC + dABpAC | ||
| One win and one loss, GDA > 0 | p>0 (pABpCA + pBApAC) | ||
| One win and one loss, GDA = 0, i ≥ j | p0,i≥j (pABpCA + pBApAC) | ✔ | |
| One win and one loss, GDA = 0, i < j | p0,i<j (pABpCA + pBApAC) | ✔ | ✔ |
| One win and one loss, GDA < 0 | p<0 (pABpCA + pBApAC) | ✔ | ✔ |
| Two draws | dABdAC | ✔ | |
| One draw and one loss | pBAdAC + dABpCA | ✔ | |
| Two losses | pBApCA |
Proposition 3. The probability that there is a risk of match fixing in a given group of three is
(1)
The probability that there is an aggravated risk of match fixing in a given group of three is
(2)
In the case of perfect competitive balance,
The next two remarks, which are trivial consequences of Proposition 3, give sufficient conditions under which the risk of collusion is maximal or minimal.
Remark 4. The probability that there is a risk of match fixing is maximal, equal to 1, in the case where dAB = dAC = 1.
This remark somewhat explains why it has been reported that FIFA has considered banning draws during the group stage (The Daily Mail, 2017; The New York Times, 2017; World Soccer, 2018). All group stage matches would have a winner and a loser, possibly decided by a penalty shootout in the case where two teams are tied after 90 minutes. The impact of banning draws will be thoroughly investigated in Sections 6 and 7. Note that forbidding draws does not eliminate the risk of collusion. For instance, the situations where Team A has one win and one loss and a nonpositive goal difference will still be prone to match fixing.
Remark 5. The probability that there is a risk of match fixing is minimal, equal to 0, if one of the following conditions holds:
(i) pAB = 1 and (pCA = 0 or p≤0 = 0): A surely wins against B, and it cannot lose against C, or if it loses against C its global goal difference GDA can only be positive.
(ii) pAC = 1 and (pBA = 0 or p≤0 = 0): A surely wins against C, and it cannot lose against B, or if it loses against B its global goal difference GDA can only be positive.
(iii) pBA = pCA = 1: A surely loses against B and C.
This remark indicates that in order to minimize the risk of match fixing, Team A should be the a priori strongest team in the group (so it is close to satisfy one of the first two conditions above) or the a priori weakest team in the group, if very weak (so it is close to satisfy the last condition above). Team A should not be the middle team. However, conditions (i), (ii), or (iii) are never satisfied in practice: even when a soccer powerhouse meets an underdog, there is always a positive probability that the underdog draws or wins, even if it is small. This means that in practice the risk of match fixing cannot be avoided. In particular, we have:
Corollary 5. Assume one of the following conditions:
(i) All the probabilities pAB, pBA, pAC, pCA, p≤0 are strictly positive.
(ii) The probabilities dAB and dAC are strictly positive.
Then the risk of collusion cannot be avoided: pRMF > 0.
Finally, the next proposition is also an immediate consequence of Proposition 3. It quantifies the probability that there will be a risk of collusion in at least one of the 16 groups.
Proposition 7. Let us assume that the same values of pAB, pBA, pAC, pCA, p<0, and p≤0 apply to all 16 groups of the World Cup, and that the results in the 16 groups are all independent. Let pRMF and
For the numerical examples presented just after Proposition 3, we get
4Impact of the match schedule on the risk of collusion
Let us consider a realistic example of a 2026 World Cup group given in Table 4, with a strong team S, a middle team M, and a weak team W. There are three possible choices for Team A: S, M, and W, corresponding to three possible match schedules.4 We naturally assume that the stronger Team A is, the smaller p≤0 and p<0 + p0,i<j are (see Table 5). The numerical values of the probabilities pSM, pSW, pMS, pMW, pWS, and pWM in Table 4, as well as those of the conditional probabilities p≤0 and p<0 + p0,i<j in Table 5, are made up but plausible. They mostly serve for illustration purposes, so that we can grasp the order of magnitude of the risk of collusion. Note that one cannot directly statistically estimate those probabilities from past World Cups as in 2026 many of the 16 new finalists (one per group) will likely be much weaker than recent World Cup finalists.5 Another numerical example, corresponding to a more strongly imbalanced group, is investigated in Section 5 to illustrate the impact of the competitive balance on the risk of collusion.
Table 4
Win probabilities: pXY is the probability that Team X wins against Team Y
| Win prob. | S | M | W |
| S (Strong) | pSM = 50% | pSW = 80% | |
| M (Middle) | pMS = 20% | pMW = 50% | |
| W (Weak) | pWS = 5% | pWM = 20% |
Table 5
Probabilities of risk of match fixing pRMF, probabilities of risk of match fixing pRMF (16) in at least one of the 16 groups, and average number
| A | S | M | W |
| p≤0 | 30% | 60% | 90% |
| p<0 + p0,i<j | 18% | 48% | 84% |
| pRMF | 14.6% | 47.4% | 52.7% |
|
| 3.3% | 13.9% | 15.5% |
| pRMF (16) | 91.9% | 99.997% | 99.999% |
|
| 41.8% | 90.9% | 93.3% |
|
| 2.3 | 7.6 | 8.4 |
|
| 0.5 | 2.2 | 2.5 |
The corresponding values of pRMF and
Note that if this schedule (A = S) is implemented:
1 The a priori strongest team in the group, if it is not already qualified after Match 2, might be the victim of a collusion between the two other teams.
2 The a priori strongest team in the group, if it advances to the knockout stage, will enjoy more rest days than the other qualified team before the round of 32.
3 In all groups, the third match will oppose the two a priori weakest teams in the group.
The probabilities pRMF (16) (resp.
5Impact of competitive balance on the risk of collusion
Tables 6 and 7 compare three situations of competitive balance within a group: perfect balance (the three teams are equally skilled), imbalance (there is a strong team, a middle team, and a weak team), and strong imbalance (the strong team is much stronger than the weak team). Of course, only the last two cases are realistic for the World Cup, because of the seeding procedure used to build the groups (Guyon, 2014, 2015). Note that the middle columns of Table 7 (Imbalance) coincide with Table 5.
Table 6
Win probabilities: pXY is the probability that Team X wins against Team Y
| Perfect balance | Imbalance | Strong imbalance | |||||||
| Win prob. | S | M | W | S | M | W | S | M | W |
| S (Strong) | 37.5% | 37.5% | 50% | 80% | 70% | 90% | |||
| M (Middle) | 37.5% | 37.5% | 20% | 50% | 10% | 70% | |||
| W (Weak) | 37.5% | 37.5% | 5% | 20% | 2% | 10% | |||
Table 7
Probabilities of risk of match fixing pRMF, probabilities of risk of match fixing pRMF (16) in at least one of the 16 groups, and average number
| Perfect balance | Imbalance | Strong imbalance | |||||
| A | S/M/W | S | M | W | S | M | W |
| p≤0 | 60% | 30% | 60% | 90% | 30% | 60% | 90% |
| p<0 + p0,i<j | 48% | 18% | 48% | 84% | 18% | 48% | 84% |
| pRMF | 41.9% | 14.6% | 47.4% | 52.7% | 5.9% | 50.0% | 34.6% |
|
| 13.5% | 3.3% | 13.9% | 15.5% | 1.9% | 24.0% | 8.7% |
| pRMF (16) | 100.0% | 91.9% | 100.0% | 100.0% | 62.3% | 100.0% | 99.9% |
|
| 90.2% | 41.8% | 90.9% | 93.3% | 26.1% | 98.8% | 76.8% |
|
| 6.7 | 2.3 | 7.6 | 8.4 | 0.9 | 8.0 | 5.3 |
|
| 2.2 | 0.5 | 2.2 | 2.5 | 0.3 | 3.8 | 1.4 |
As can be seen from these tables, when Team A is the strongest team in the group, the stronger the imbalance, the smaller the risk of collusion. This is because A is more likely to be already qualified after Match 2. However, when Team A is the weakest team in the group, the risk of collusion is not a monotonic function of imbalance.
Note that, even in the most favorable case where all groups are highly imbalanced and in all groups Team A is the strongest team, the risk of a collusion in at least one of the 16 groups is still larger than 60%, and match fixing will be possible in 0.9 group on average.
6Impact of forbidding draws on the risk of collusion: the 3-0 point system
As mentioned after Remark 3, FIFA has considered banning draws during the group stage in order to limit the risk of collusion. In this section we investigate how efficient this ban would be. We assume a 3-0 point system: in the case of a draw, the winner of the penalty shootout earns 3 points, while the loser gets nothing. Another point system (3-2-1-0) will be investigated in Section 7. We also assume that the result of the penalty shootout does not impact the goal difference, and that both teams have equal chances to win the penalty shootout.
Remark 8. The 3-0 point system has undesirable consequences. For instance, imagine that A wins against B and loses against C, in both cases after 90 minutes (no penalty shootouts). Then, in the traditional 3-1-0 system, a draw between B and C would eliminate B (C: 4 points, A: 3, B: 1). In the 3-0 point system, this draw between B and C must be resolved as a win/loss by a penalty shootout. By winning the penalty shootout, B could eliminate A or C, which seems unfair as, unlike B, Teams A and C got proper wins after 90 minutes. Worse, depending on goal differences, Team C could have secured the first place before the penalty shootout, and then decide to eliminate Team A by deliberately losing the penalty shootout at no cost (aggravated risk of match fixing on penalties, see below).
It is tempting to apply the results of Section 3 with the new values
To ease comparisons with the 3-1-0 point system, we still speak of a draw for a match that is tied after 90 minutes and is decided by a penalty shootout, and of a win or a loss for games whose result is decided after 90 minutes. We recall that the risk of match fixing is aggravated when Team B or C can win the group even after losing its last game. When draws are banned, we introduce another notion of aggravated risk of match fixing: we say that there is an aggravated risk of match fixing on penalties when Team B or C can win the group and eliminate Team A even after drawing its last game and losing on penalties. In such a case, Teams B and C may agree (explicitly or not) on a draw, and the team leading in the rankings can at no expense decide to eliminate Team A by losing the penalty shootout—a situation that would certainly be described as scandalous by Team A, its fans, and the media, and that FIFA surely wants to avoid by all means.
The next proposition compares the 3-0 point system with the 3-1-0 point system in terms of risk of collusion. It shows that forbidding draws indeed always decreases the risk of collusion, but it actually increases the probability of an aggravated risk of collusion.
Proposition 9. (i) The situations of risk of match fixing in a given group of three in the 3-0 point system are exactly the following ones:
1. Team A has one win and one loss and GDA ≤ 0.
2. Team A has two draws with one win and one loss on penalties.
3. Team A has one draw won on penalties and one loss.
The corresponding probability is
(ii) The situations of aggravated risk of match fixing are exactly the following ones:
1. Team A has one win (m + i) - i and one loss j - (n + j), and GDA : = m-n < 0 or {GDA = 0 and i < j}.
2. Team A has one draw i - i won on penalties and one loss j - (n + j), and we are in Case 1:
• n ≥ 3, or
• n = 2 and i = 0, or
• n = 2, i ≠ 0, and j ≥ i.
The corresponding probability is
(iii) The situations of aggravated risk of match fixing on penalties are exactly the following ones:
1. Team A has one draw (won on penalties) and one loss.
2. Team A has two draws i - i (won on penalties) and j - j (loss on penalties), and i < j.
3. Team A has one win (m + i) - i and one loss j - (n + j), GDA : = m-n < 0, and 2m ≤ n.
The corresponding probability is
Proof. Let us review all the possible situations after Match 2. If Team A has 6 points, it is already qualified and no match fixing can eliminate them. If Team A has 0 points, it is already eliminated. If Team A has 3 points, one must consider the sign of the goal difference GDA:
1. GDA > 0: It is easy to check that, like in the 3-1-0 point system, Team A is already qualified and no match fixing can eliminate them.
2. GDA < 0: The situation slightly differs from the 3-1-0 point system due to the fact that A may have won its game on penalties, with a zero goal difference. Team A has won against, say, B with a margin of m ≥ 0 goals (m = 0 corresponds to a win on penalties), and lost to C with a margin of n ≥ 1 goals, with GDA = m-n < 0 (the roles of B and C can be swapped).
• There is an aggravated risk of match fixing on penalties if and only if 2m ≤ n. Indeed, if 2m < n, by drawing with B and losing on penalties, C would eliminate A and win the group. If 2m = n, B and C would need to draw k - k with k large enough so that B has the same goal difference as A but a larger number of goals scored. If 2m > n, then if B and C draw, A has a strictly better goal difference than B so it cannot be eliminated after B and C draw.
• If m ≥ 1, there is an aggravated risk of match fixing, like in the 3-1-0 point system.
• If m = 0, A and B have drawn and A has won on penalties. In some cases there can be an aggravated risk of match fixing:
- If n ≥ 3, or if n = 2 and A - B was a goalless draw, then C can afford to lose 1-0 against B and still eliminate A and win the group (aggravated risk of match fixing).
- If n = 2 and A - B was not a goalless draw, then there is an aggravated risk of match fixing if and only if C scored at least two more goals than B in their games against A (due to Criterion 3).
- If n = 1 there cannot be an aggravated risk of match fixing (of the first type), since if C loses against B after 90 minutes, it will be behind B in the rankings, due to a smaller goal difference. However, there is a risk of match fixing.
3. GDA = 0:
• If Team A won one game (say, against B) and lost the other within 90 minutes, then the situation is similar to the 3-1-0 point system: there is a risk of collusion, which is aggravated (of the first type) if and only if i < j (defined before Proposition 1). There can be no aggravated risk of collusion on penalties as if B and C draw, A will finish ahead of B even if B wins the penalty shootout, due to a better goal difference.
• If Team A drew twice and won one penalty shootout (say, against B) and lost the other (say, against C), then by drawing k - k with k large enough both B and C would advance if B wins the penalty shootout. Team C would finish ahead of B only if it scored more goals (j) than B (i) when both teams tied with A (strictly more, due to Criterion 3, extended to win on penalties). Therefore there is a risk of match fixing, and there is an aggravated risk of match fixing on penalties if and only if i < j. There can be no aggravated risk of match fixing of the first type, since if C loses against B after 90 minutes, it will be behind both A and B in the rankings, due to a smaller goal difference. □
Table 8 summarizes all the possible situations of Team A after Match 2 in the 3-0 point system, their probabilities, and whether they lead to a risk of match fixing (RMF), an aggravated risk of match fixing (RMF*), and an aggravated risk of match fixing on penalties (
• Team A has two draws. There is no more risk of match fixing if A wins both penalty shootouts—in this case A is already qualified—or if it loses both penalty shootouts—in this case A is already eliminated. This decreases the probability that there is a risk of match fixing by
• Team A has one draw and one loss. There is no more risk of match fixing if A loses on penalties—in this case A is already eliminated. This decreases the probability that there is a risk of match fixing by
However, compared to the 3-1-0 point system, one new situation leads to an aggravated risk of match fixing:
• Team A has one draw and one loss. There is now an aggravated risk of match fixing if A wins the penalty shootout and we are in Case 1.
Table 8
Summary of all the possible situations of Team A after Match 2 in the 3-0 point system, their probabilities, and whether they lead to a risk of match fixing (RMF), an aggravated risk of match fixing (RMF*) of the first type, or an aggravated risk of match fixing on penalties (
| Situation of Team A after Match 2 | nb pts A | Probability | RMF | RMF* |
|
| Two wins | 6 | pABpAC | |||
| One win and one draw, win on pen. | 6 |
| |||
| One win and one draw, loss on pen. | 3 |
| |||
| One win and one loss, GDA > 0 | 3 | p>0 (pABpCA + pBApAC) | |||
| One win and one loss, GDA = 0, i ≥ j | 3 | p0,i≥j (pABpCA + pBApAC) | ✔ | ||
| One win and one loss, GDA = 0, i < j | 3 | p0,i<j (pABpCA + pBApAC) | ✔ | ✔ | |
| One win and one loss, GDA < 0 | 3 | p<0 (pABpCA + pBApAC) | ✔ | ✔ | if 2m ≤ n |
| Two draws, two wins on pen. | 6 |
| |||
| Two draws, one win and one loss on pen. | 3 |
| ✔ | if i < j | |
| Two draws, two losses on pen. | 0 |
| |||
| One draw and one loss, win on pen., case 1 | 3 |
| ✔ | ✔ | ✔ |
| One draw and one loss, win on pen., case 2 | 3 |
| ✔ | ✔ | |
| One draw and one loss, loss on pen. | 0 |
| |||
| Two losses | 0 | pBApCA |
Like in the previous section, Table 9 compares the three situations of competitive balance within a group, but now in the 3-0 point system. Let us compare Tables 7 and 9. Banning draws would indeed decrease the risk of collusion, but not much: for a reasonably unbalanced group, the risk of collusion would be around 10% (down from 15%) if the strongest team plays the first two group games and around 33% (down from 50%) otherwise. For a strongly unbalanced group, the risk of collusion would decrease to 4.5% (down from 5.9%) if the strongest team plays the first two group games, to around 22% (down from 35%) if the weakest team plays the first two group games, and to around 40% (down from 50%) if the middle team plays the first two group games. The probability that at least one group faces risk of collusion would still be very high, at about 52% (down from 62%) in the most favorable case (strong imbalance, A = S), and close to 100% in many cases. Even in the most favorable case, it is more likely that match fixing will be possible in at least one group than not.
Table 9
Probabilities of risk of match fixing
| Perfect balance | Imbalance | Strong imbalance | |||||
| A | S/M/W | S | M | W | S | M | W |
| p≤0 | 60% | 30% | 60% | 90% | 30% | 60% | 90% |
| p<0 | 40% | 10% | 40% | 80% | 10% | 40% | 80% |
| p<0 + p0,i<j | 48% | 18% | 48% | 84% | 18% | 48% | 84% |
| pcase1 | 60% | 40% | 60% | 90% | 40% | 60% | 90% |
| p2d,i<j | 35% | 35% | 35% | 35% | 35% | 35% | 35% |
| p2m≤n | 70% | 70% | 70% | 70% | 70% | 70% | 70% |
|
| 29.4% | 10.1% | 32.4% | 34.7% | 4.5% | 40.0% | 22.0% |
|
| 19.1% | 4.2% | 20.2% | 29.7% | 2.1% | 28.8% | 19.4% |
|
| 18.3% | 4.3% | 20.2% | 26.9% | 1.6% | 22.7% | 17.9% |
|
| 99.6% | 81.6% | 99.8% | 99.9% | 52.3% | 100.0% | 98.1% |
|
| 96.7% | 49.9% | 97.3% | 99.6% | 28.9% | 99.6% | 96.8% |
|
| 96.1% | 50.8% | 97.3% | 99.3% | 22.8% | 98.4% | 95.7% |
|
| 4.7 | 1.6 | 5.2 | 5.5 | 0.7 | 6.4 | 3.5 |
|
| 3.1 | 0.7 | 3.2 | 4.8 | 0.3 | 4.6 | 3.1 |
|
| 2.9 | 0.7 | 3.2 | 4.3 | 0.3 | 3.6 | 2.9 |
As shown in Proposition 9, forbidding draws actually increases the probability of aggravated risk of collusion, the most dangerous form of match fixing. In the most favorable case (strong imbalance, A = S), the probability that at least one group faces aggravated risk of collusion increases to around 29% (up from 26%). For a reasonably unbalanced group, if A = S, it increases to 50% (up from 42%). In all other cases, it is larger than 96%.
As for the new aggravated risk of collusion (on penalties), its probability is quite similar to that of the aggravated risk of collusion (after 90 minutes), which means that the total probability of an aggravated risk of collusion (after 90 minutes and on penalties) is roughly speaking doubled compared to the 3-1-0 point system. This higher aggravated risk of collusion is the main drawback of the 3-0 point system, together with the flaw described in Remark 8.
7Impact of forbidding draws on the risk of collusion: the 3-2-1-0 point system
In this section we investigate another natural point system, the 3-2-1-0 point system, in the hope that it will do a better job at decreasing the risk of collusion. We still assume that draws are forbidden but now we assume that the winner of a tied game decided by a penalty shootout wins 2 points, instead of 3 points, while the loser wins 1 point, instead of 0 points. In this case, in all group matches, 3 points are distributed to the teams: either 3 + 0, if there is a winner at the end of the 90 minutes of play, or 2 + 1 if the game is tied and is decided by a penalty shootout. This 3-2-1-0 point system was used in the 1988-89 season of the Argentinian League (Palacios-Huerta, 2014, Chapter 10). The 1994-95 National Soccer League season in Australia has applied a modified version: 4 points for a win, 2 for a win on penalties, 1 for a penalty loss and no points for a loss in regulation time (Kendall and Lenten, 2017, Section 3.9.7).6 At first sight it seems that the 3-2-1-0 point system, which is natural and plausible, would significantly reduce the risk of collusion by increasing the number of possible point scenarios after Match 2. This was in particular argued by Palacios-Huerta (2018) after we published two articles in The New York Times (Guyon, 2018a; Guyon and Monkovic, 2018) based on a first version of this work. Let us check to what extent this is true. To ease comparisons with the other point systems, we still speak of a draw for a match that is tied after 90 minutes and is decided by a penalty shootout, and of a win or a loss for games whose result is decided after 90 minutes. Remark 10. One benefit of the 3-2-1-0 point system is that it does not have the flaw of the 3-0 point system that was described in Remark 8: if A wins against, say, B and loses against C, in both cases after 90 minutes (no penalty shootouts), then, like in the traditional 3-1-0 system, a draw between B and C would automatically eliminate B, even if B wins the penalty shootout.
The following proposition describes the situations of possible collusion in the 3-2-1-0 point system.
Proposition 11. (i) In the 3-2-1-0 point system, risk of match fixing occurs exactly in the following cases:
1. Team A has one draw and one loss, and wins the penalty shootout.
2. Team A has two draws, and loses at least one of the two penalty shootouts.
3. Team A has one win and one loss and a goal difference GDA ≤ 0.
In particular,
• GDA < 0, or
• GDA = 0 and i < j (i and j are defined just before Proposition 1).
1. Team A has one draw and one loss and wins the penalty shootout.
2. Team A has two draws i - i (won on penalties) and j - j (loss on penalties), and i < j.
Proof. Let us review all the possible situations after Match 2:
1. Team A has two wins. Then Team A has 6 points and advances to the knockout stage. No match fixing can eliminate them.
2. Team A has one win and one draw. Then Team A has either 4 or 5 points and advances to the knockout stage. No match fixing can eliminate them.
3. Team A has one win and one loss. The situation is similar to the 3-1-0 point system: match fixing will be possible if and only if GDA ≤ 0, and there is aggravated risk of match fixing if and only if GDA < 0, or GDA = 0 and i < j (see proof of Proposition 1). There can be no aggravated risk of match fixing on penalties.
4. Team A has two draws. If A wins the two penalty shootouts, then it has 4 points, advances to the knockout stage, and no match fixing can eliminate them. Otherwise there is a risk of match fixing:
• If A loses the two penalty shootouts, then all three teams have 2 points after Match 2. A draw between B and C, whoever wins the penalty shootout, will eliminate A. But there is no aggravated risk of match fixing (after 90 minutes or on penalties).
• If A wins exactly one of the two penalty shootouts, then it has 3 points, while B, say, has 1 point, and C 2 points. Then if B and C draw k - k with k large enough, and B wins the penalty shootout, all teams will have 3 points, 0 goal difference, and B and C will eliminate A thanks to a larger number of goals scored. There is an aggravated risk of match fixing on penalties if and only if the team who beat A on penalties (C in our example) scored strictly more goals against A than B did (strictly, because of tiebreaker Criterion 3, extended to wins on penalties). However, there is no aggravated risk of match fixing of the first type.
5. Team A has one draw and one loss. If A loses the penalty shootout, it is already eliminated. Otherwise there is a risk of match fixing: A has 2 points, while B, say, has 1 point, and C 3 points; a win of B against C eliminates A; so does a draw, if B wins the penalty shootout. In this last case, C is already guaranteed to win the group after 90 minutes and has no interest in winning the penalty shootout. They may decide to lose the penalty shootout to eliminate A. There is an aggravated risk of match fixing on penalties. There is no aggravated risk of match fixing (after 90 minutes) though, since if C loses after 90 minutes it cannot win the group.
6. Team A has two losses. Then Team A has zero point and is already eliminated. □
Table 10 summarizes all the possible situations of Team A after Match 2 in the 3-2-1-0 point system, their probabilities, and whether they lead to a risk of match fixing (RMF), an aggravated risk of match fixing (RMF*), and an aggravated risk of match fixing on penalties (
• Team A has two draws. There is no more risk of match fixing if A wins both penalty shootouts—in this case A is already qualified. This decreases the probability that there is a risk of match fixing by
• Team A has one draw and one loss. There is no more risk of match fixing if A loses on penalties—in this case A is already eliminated. This decreases the probability that there is a risk of match fixing by
Table 10
Summary of all the possible situations of Team A after Match 2 in the 3-2-1-0 point system, their probabilities, and whether they lead to a risk of match fixing (RMF), an aggravated risk of match fixing (RMF*), and an aggravated risk of match fixing on penalties (
| Situation of Team A after Match 2 | Probability | RMF | RMF* |
|
| Two wins | pABpAC | |||
| One win and one draw | pABdAC + dABpAC | |||
| One win and one loss, GDA > 0 | p>0 (pABpCA + pBApAC) | |||
| One win and one loss, GDA = 0, i ≥ j | p0,i≥j (pABpCA + pBApAC) | ✔ | ||
| One win and one loss, GDA = 0, i < j | p0,i<j (pABpCA + pBApAC) | ✔ | ✔ | |
| One win and one loss, GDA < 0 | p<0 (pABpCA + pBApAC) | ✔ | ✔ | |
| Two draws, two wins on penalties |
| |||
| Two draws, one win and one loss on penalties |
| ✔ | if i < j | |
| Two draws, two losses on penalties |
| ✔ | ||
| One draw and one loss, win on penalties |
| ✔ | ✔ | |
| One draw and one loss, loss on penalties |
| |||
| Two losses | pBApCA |
Note that the probabilities of an aggravated risk of match fixing (of the first or second types) are smaller in the 3-2-1-0 point system, compared to the 3-0 point system. This seems to indicate that, if FIFA wants to ban draws to reduce the risk of collusion, it should adopt the 3-2-1-0 point system, rather than the 3-0 point system. However, surprisingly, the global risk of collusion is higher in the 3-2-1-0 point system than in the 3-0 point system:
• Team A has two draws. There is now a risk of match fixing if A loses both penalty shootouts—in this case A is already eliminated in the 3-0 point system, but may still qualify in the 3-2-1-0 point system, and is subject to possible collusion. This increases the probability that there is a risk of match fixing by
The various probabilities of risk of match fixing and average number of groups with a risk of match fixing in the 3-2-1-0 system are reported in Table 11, for the numerical example of Table 6.
Table 11
Probabilities of risk of match fixing
| Perfect balance | Imbalance | Strong imbalance | |||||
| A | S/M/W | S | M | W | S | M | W |
| p≤0 | 60% | 30% | 60% | 90% | 30% | 60% | 90% |
| p<0 | 40% | 10% | 40% | 80% | 10% | 40% | 80% |
| p<0 + p0,i<j | 48% | 18% | 48% | 84% | 18% | 48% | 84% |
| p2d,i<j | 35% | 35% | 35% | 35% | 35% | 35% | 35% |
|
| 30.9% | 11.2% | 34.7% | 35.8% | 4.9% | 41.0% | 22.4% |
|
| 13.5% | 3.3% | 13.9% | 15.5% | 1.9% | 24.0% | 8.7% |
|
| 10.5% | 3.0% | 12.1% | 16.5% | 0.9% | 8.7% | 12.1% |
|
| 99.7% | 85.0% | 99.9% | 99.9% | 73.2% | 99.9% | 98.3% |
|
| 90.2% | 41.8% | 90.9% | 93.3% | 26.1% | 98.8% | 76.8% |
|
| 83.0% | 39.0% | 87.2% | 94.5% | 13.2% | 76.7% | 87.3% |
|
| 5.0 | 1.8 | 5.6 | 5.7 | 0.8 | 6.6 | 3.6 |
|
| 2.2 | 0.5 | 2.2 | 2.5 | 0.3 | 3.8 | 1.4 |
|
| 1.7 | 0.5 | 1.9 | 2.6 | 0.1 | 1.4 | 1.9 |
8Discussion
Fig. 1
Comparison of probability (in %) of (a) risk of match fixing for a given group; (b) aggravated risk of match fixing for a given group; (c) risk of match fixing in at least one of the 16 groups; (d) aggravated risk of match fixing in at least one of the 16 groups, in three different point systems, for three competitive balance assumptions, and the three schedules A = S, M, or W.
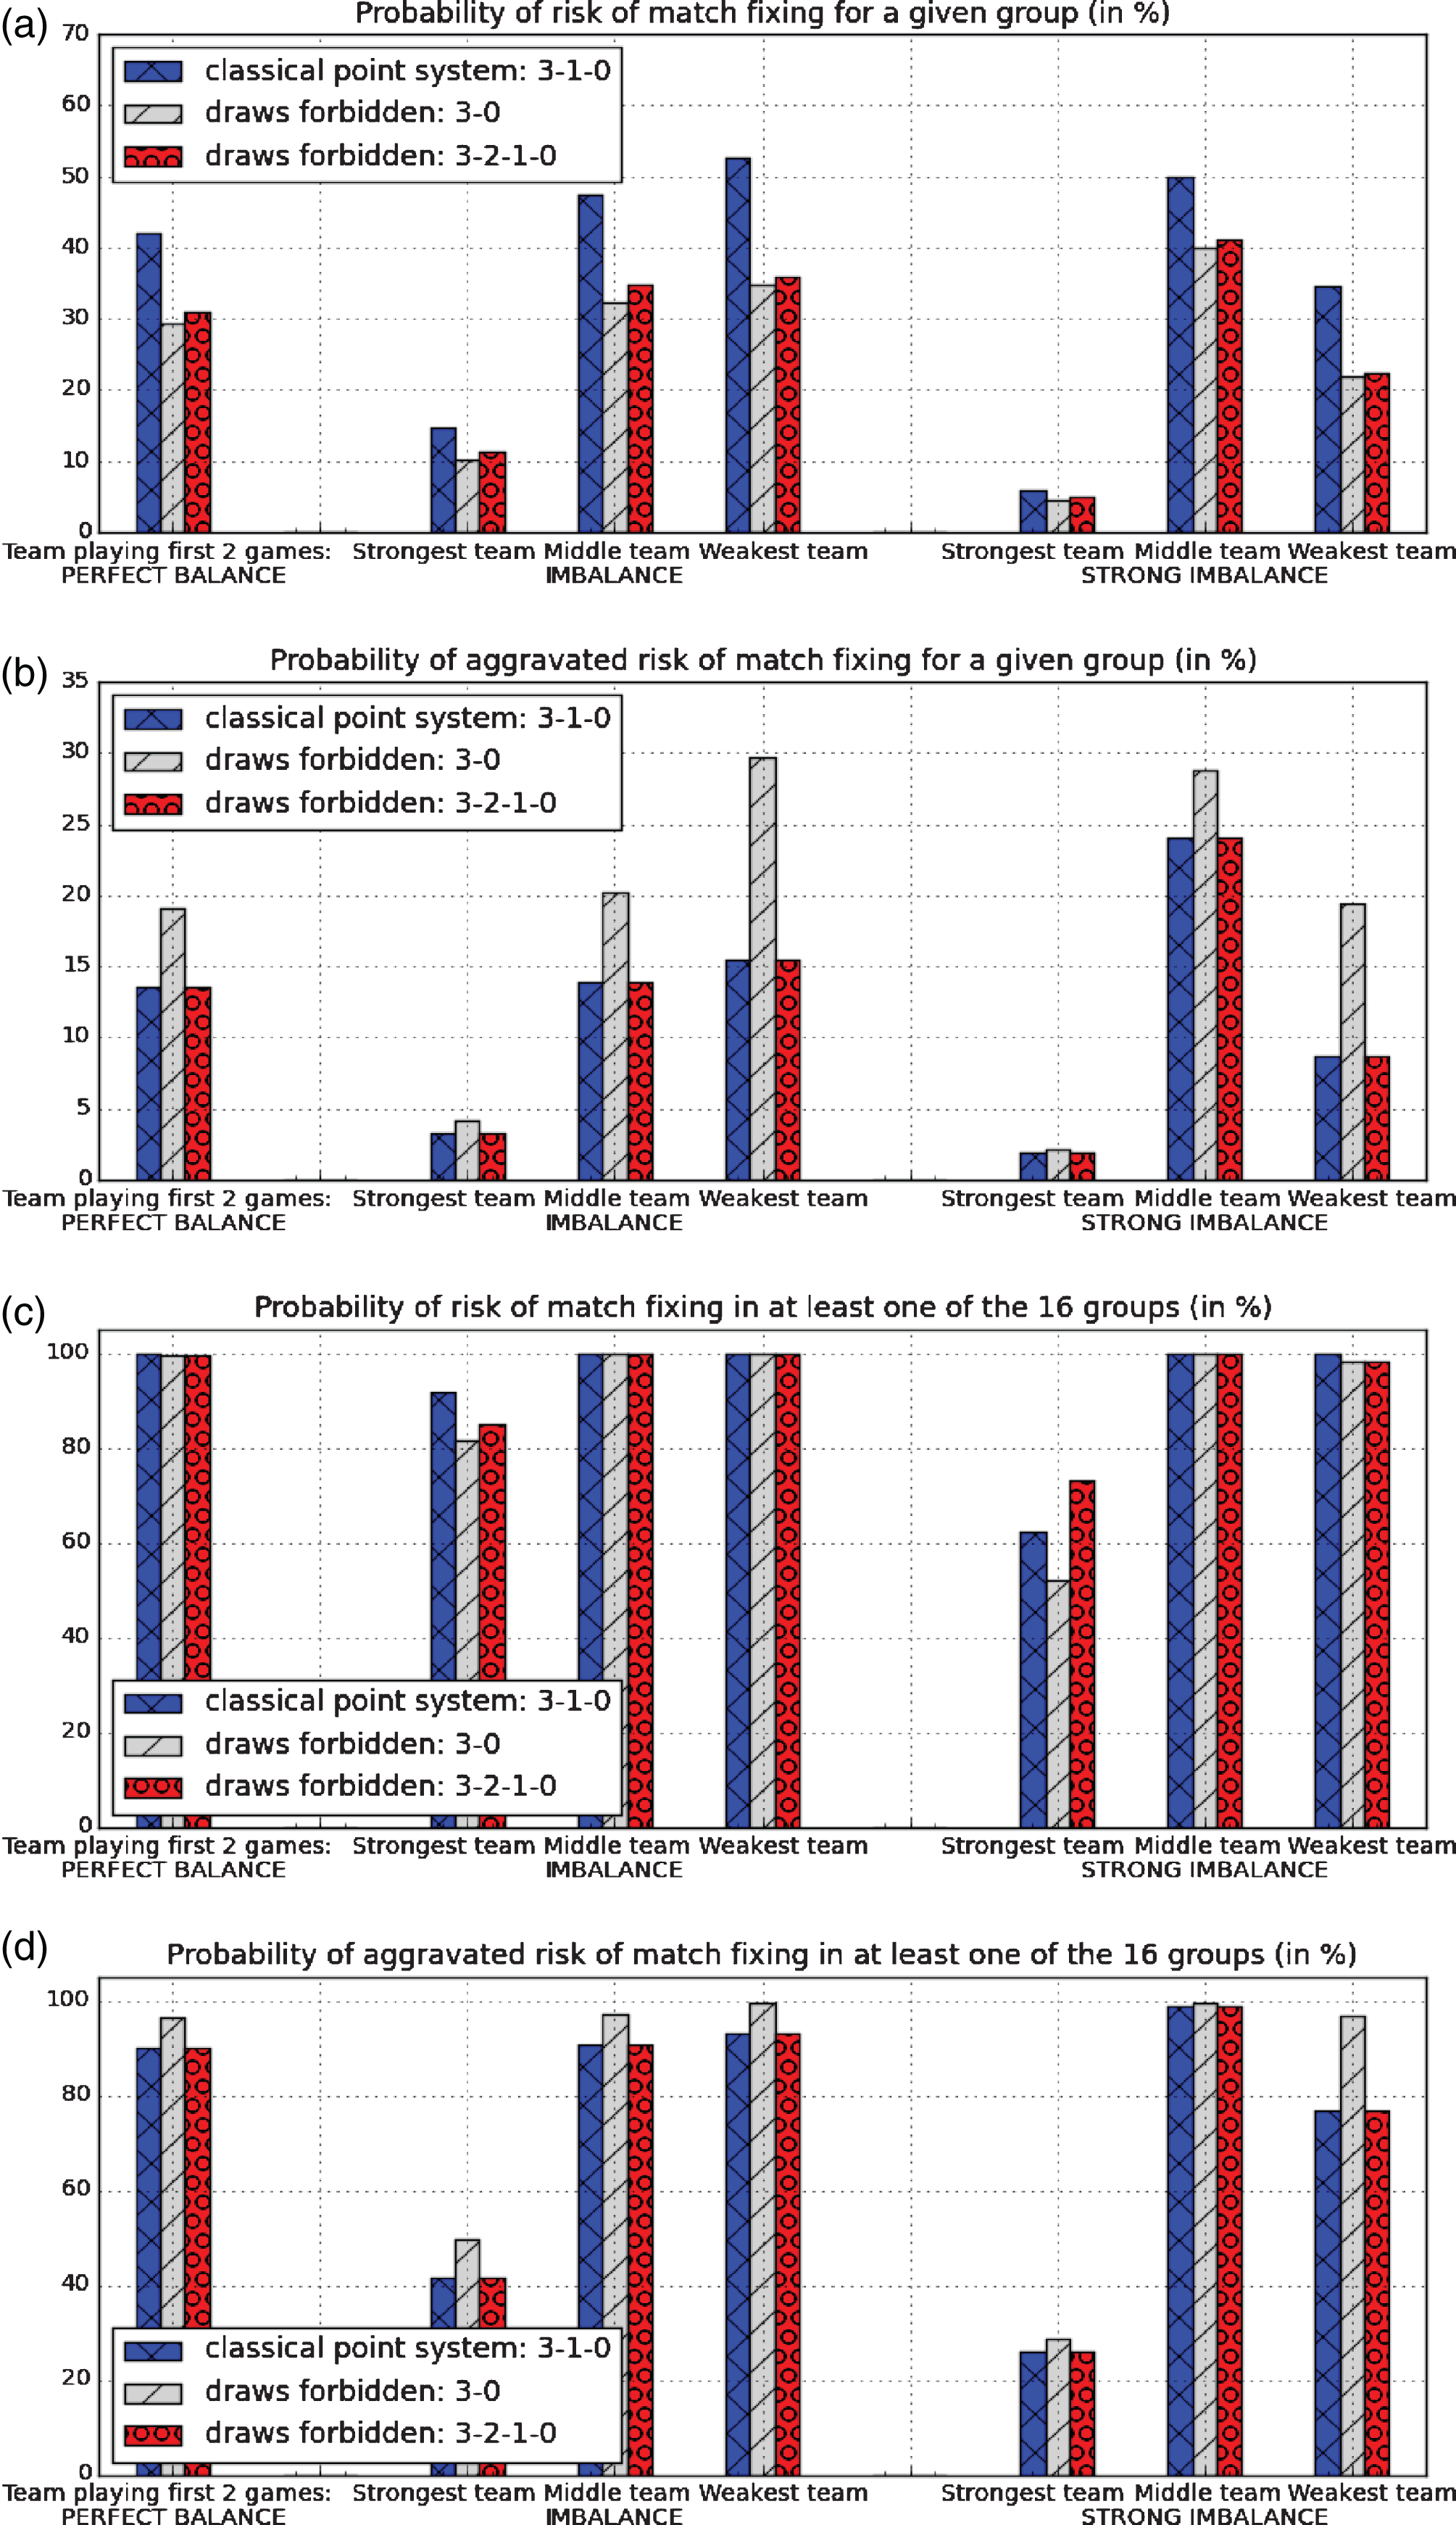
Figure 1 compares the probability of (a) risk of match fixing for a given group; (b) aggravated risk of match fixing for a given group; (c) risk of match fixing in at least one of the 16 groups; (d) aggravated risk of match fixing in at least one of the 16 groups, in the three different point systems 3-1-0, 3-0, 3-2-1-0, for the three competitive balance assumptions of Table 6, and the three schedules A = S, M, or W. It shows that:
• Clearly the most important factor impacting the risk of match fixing is the schedule: the risk of match fixing is minimized when it is the a priori strongest team that plays the first two games in the group.
• Forbidding draws and adopting the 3-0 point system decreases the risk of collusion, but increases the probability of aggravated risk of match fixing.
• Surprisingly, compared to the 3-0 point system, the risk of match fixing is slightly larger in the 3-2-1-0 point system; but, compared to the classical 3-1-0 point system, it is slightly smaller.
The probability of aggravated risk of match fixing in the 3-2-1-0 point system is exactly the same as in the 3-1-0 point system. However, banning draws introduces problematic situations where a team may decide to eliminate another team by deliberately losing the penalty shootout (aggravated risk of match fixing on penalties).
Fig. 2
Comparison of probability (in %) of (a) aggravated risk of match fixing (after 90 minutes and on penalties) for a given group; and (b) aggravated risk of match fixing (after 90 minutes and on penalties) in at least one of the 16 groups, in the 3-2-1-0 point system, for three competitive balance assumptions, and the three schedules A = S, M, or W.
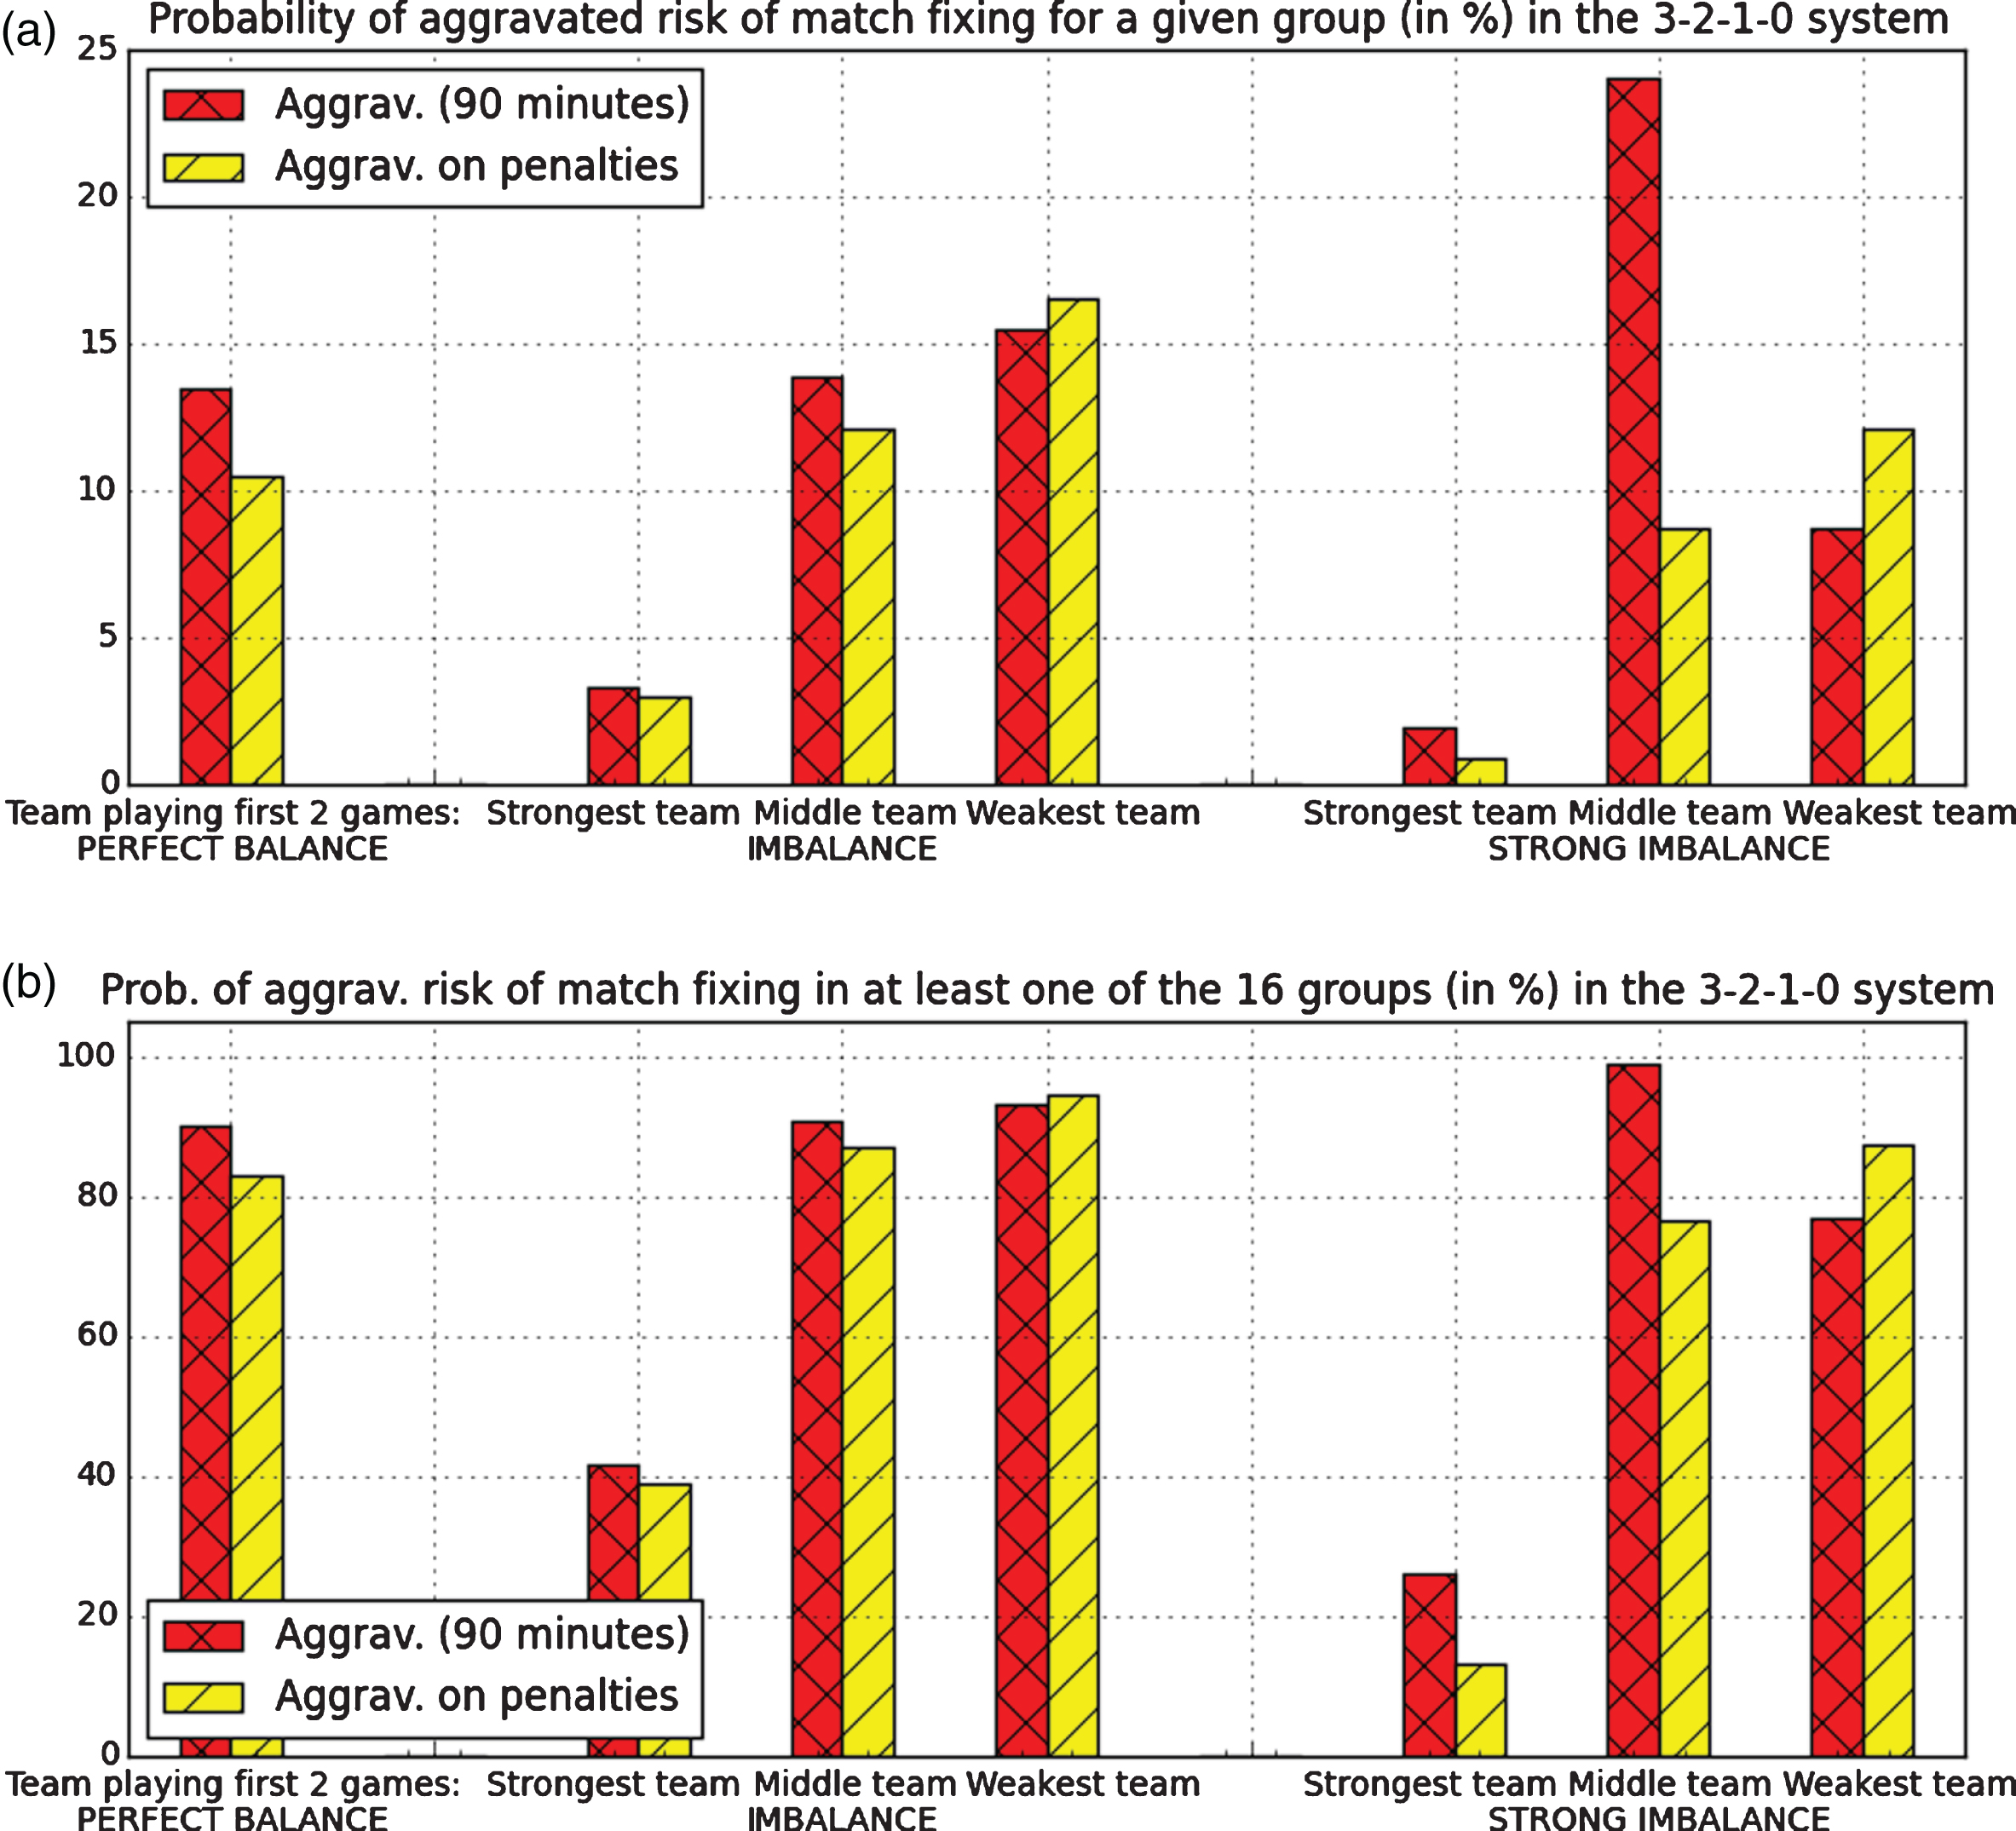
Eventually, it seems that, among the two alternative point systems considered here, the 3-2-1-0 point system would be the most efficient to decrease the risk of collusion. Indeed, it does significantly decrease the global risk of collusion compared to the classical 3-1-0 point system (almost as much as the 3-0 point system), and, unlike the 3-0 point system, it does not increase the aggravated risk of collusion. However, like the 3-0 point system, it introduces a very problematic kind of aggravated risk of collusion (on penalties). Figure 2 shows that in the 3-2-1-0 point system the probability of an aggravated risk of match fixing on penalties is almost as large as that of an aggravated risk of match fixing (after 90 minutes) in most cases. (Note that there is a substantial difference between them in the case of strong imbalance.)
9Alternate formats
Assuming a 48-team World Cup, what alternate formats could FIFA use which would significantly decrease, or even eradicate, the risk of collusion? We have examined a few possible formats in (Guyon, 2018a) and (Guyon and Monkovic, 2018), which we summarize here. All the formats listed below take into account the requirement that the tournament should not last too long; the total number of matches should not exceed, say, 100. This precludes the classical round-robin format with eight groups of six—in this format the group stage only would feature 120 games. See however Format 6. Table 12 summarizes and compares the various formats.
• Format 1: 12 groups of four. The 12 group winners, 12 runners-up, and eight best third-place teams would advance to the round of 32. However, with 72 group matches and a total of 104 games, the World Cup would then last at least one more week, assuming four group matches per day. Both the current format (1998-2018, 64 games) and the three-team group format (80 games) can be completed in 32 days. Since the number of groups would not be a power of two, the knockout bracket would be unbalanced, in the sense that some group winners would play against third-placed teams in the round of 32, while other group winners would play against runners-up, and some runners-up would play against each other, like it happened during the round of 16 of the 1986, 1990, and 1994 FIFA World Cups, and during the 2016 UEFA Euro, and like it will happen during the Euro 2020. See Guyon (2018b) for a detailed study of such unbalanced brackets.
• Format 2: 12 groups of four, only 16 teams advance. The 12 group winners and four best runners-up would advance to the round of 16. This would decrease the total number of matches to 88 from 104. Only a third of the teams would advance to the knockout stage. The knockout bracket would still be unbalanced, with some group winners facing each other in the first round of the knockout stage, while others would play against runners-up.
• Format 3: 16 groups of three, only group winners advance. This would eliminate the risk of collusion but has several serious pitfalls. First, the last group match may be a dead rubber (when Team A has two wins). Second, there is still a fairness issue. When Team A has one win and one draw (say, against B and C, respectively), Team B is already eliminated before the last group match and may not give its best effort to defeat C. If C wins the group after beating an unmotivated Team B, Team A may feel aggrieved. Third, this example shows that in this format a team (B in this case) can be eliminated after playing just one game. Finally, the winner would play only six matches, one less than in the current format (1998–2018). On the other hand, Vong (2017) argues that to prevent strategic manipulation in tournament games, it is both necessary and sufficient to allow only the top-ranked player to qualify from each group.
• Format 4: 16 groups of three, all teams advance. Group winners would get a bye and directly advance to the round of 32, while runners-up and third-placed teams would advance to a playoff round, whose winner would qualify for the round of 32. This format would total 96 matches, which could fit in 38 days. It would indeed eliminate the risk of collusion. All teams would play a minimum of three games. The winner of the tournament would need to play seven or eight matches. Coaches, fans, TV networks and FIFA might not like the idea of group winners getting a bye, though. Those best teams would not be seen on TV in the playoff round. Also, if the group winner is Team A, they would have at least 12 rest days between their last group match and their first knockout game, which seems too long.
• Format 5: 16 groups of three, seed knockout bracket based on performance across groups. We have investigated the idea of seeding the knockout stage based on performance across groups in (Guyon, 2018b) where we illustrate how it would work for 24-team UEFA Euros. Group winners and runners-up would be ranked based on group stage performance (say for instance: points, goal differential, and number of goals scored, in that order). Then the best group winner would play against the lowest-ranked runner-up, the second best group winner against the second lowest-ranked runner-up, and so on, for example. This would incentivize all teams to perform at their best during the group stage, even if they know that a draw or even a 0-1 loss would be enough to advance to the knockout stage, thus significantly decreasing the risk of collusion. This format raises a logistics problem though: teams and fans could not plan ahead when and where they will be playing during the knockout stage if they advance. They would have to wait until the last match of the last group to know when, where, and against who they will play in the round of 32. The teams that play this last match may be unfairly advantaged, as they would know who their opponent in the round of 32 would be, depending on the result of this last match. Also, more soccer-free days would be needed between the group stage and the round of 32 to ensure a minimum of rest days to all the teams that advance, which would lengthen the tournament.
• Format 6: eight groups of six, but each team plays only three teams in their group. Each group of six is divided into two balanced subgroups of three teams. All teams in Subgroup 1 play against all teams in Subgroup 2. The best two teams over all advance to the knockout stage (they could be both from the same subgroup). To enforce balance, six pots of eight teams could be formed based on the new FIFA rankings, from Pot 1 (the eight highest-ranked teams) to Pot 6 (the eight lowest-ranked teams). One subgroup would contain teams from Pots 1, 4 and 5 (or 6), while the other subgroup would contain teams from Pots 2, 3 and 5 (or 6). Like in the current system, in this format each team plays three group matches; all teams can play simultaneously on Match Day 3 to decrease the risk of collusion; and bracket routes could be predetermined. By splitting groups of six into two balanced subgroups of three, the number of group matches would decrease to 72 from 120. There would be a total of 88 games, which could fit in about 35 days.
• Format 7: 16 groups of three, followed by eight groups of 4. The 16 groups of three are paired, e.g., Group A is paired with Group B, Group C with Group D, etc. The best two teams in each group advance to a second group stage. Teams advancing from paired groups form a group of four, and the results of the matches played during the first group stage are carried over. For example, the winner (denoted A1) and runner-up (A2) of Group A form a group of four with the winner (B1) and runner-up (B2) of Group B, and the results of the games A1–A2 and B1–B2 are carried over, so the second group stage has only four games played over two match days (for example A1–B1 and A2–B2 on Match Day 1, and A1–B2 and A2–B1 on Match Day 2. The best two teams in each group of four advance to the round of 16. Since results of the first group stage are carried over, teams have no incentive to collude. There would be 48 games during the first group stage, 32 games during the second group stage, and 16 knockout games, for a total of 96 games. The winner would play eight games, one more than in the current format and the format suggested by FIFA. Since three match days are needed for the first group stage, and two match days for the second group stage, the tournament would last at least one more week. This format has been used in handball and has been analyzed in (Csató, 2019a, 2019b).7
Table 12
Comparison of the format suggested by FIFA for the 2026 World Cup and alternate formats, Formats 1–7
| Format | FIFA | 1 | 2 | 3 | 4 | 5 | 6 | 7 |
| Nb groups | 16 | 12 | 12 | 16 | 16 | 16 | 8 | 16 then 8 |
| Nb teams per group | 3 | 4 | 4 | 3 | 3 | 3 | 6 | 3 then 4 |
| Nb of match days in group stage | 3 | 3 | 3 | 3 | 3 | 3 | 3 | 3 then 2 |
| Full round robin in each group | ✔ | ✔ | ✔ | ✔ | ✔ | ✔ | ✔ | |
| Total nb group matches | 48 | 72 | 72 | 48 | 48 | 48 | 72 | 48 + 32 = 80 |
| Nb teams in knockout round | 32 | 32 | 16 | 16 | 48 | 32 | 16 | 16 |
| Total nb matches | 80 | 104 | 88 | 64 | 96 | 80 | 88 | 96 |
| Predetermined bracket routes | ✔ | ✔ | ✔ | ✔ | ✔ | ✔ | ✔ | |
| Minimal nb matches per team | 2 | 3 | 3 | 2 | 3 | 2 | 3 | 2 |
| Maximal nb matches per team | 7 | 8 | 7 | 6 | 8 | 7 | 7 | 8 |
Remark 12. Note that for three-team groups, when only the group winner advances to the next phase, a classical procedure to avoid that the last group game be a dead rubber, i.e., a match with nothing at stake between two teams that are already eliminated, consists of enforcing a flexible schedule where the team that loses the first game, if any, plays the second group game. As pointed out to us by Keith Willoughby (University of Saskatchewan), this flexible schedule was used in Canadian university hockey years ago. However, such flexibility in the schedule does not help decrease the risk of collusion when two teams advance to the next phase.
10Conclusion
We have quantified the risk of collusion in a group of three teams playing a single round-robin tournament, where two teams advance to the next phase. We have shown that the best way to minimize the risk of collusion is to enforce that the team that plays the first two group matches is the a priori strongest team in the group, especially if the group is strongly imbalanced. However this may be deemed unfair to that team as it would be the only one vulnerable to collusion. This would also mean that Match Day 3 of the World Cup would feature none of the seeded teams.
We have quantified how competitive imbalance within a group impacts the risk of collusion. We have also quantified by how much the risk of collusion would decrease if FIFA does not use the traditional 3-1-0 point system but adopts alternate point systems that forbid draws, the 3-0 and 3-2-1-0 point systems. Even though it looks appealing on paper, the 3-2-1-0 point system does not do a better job at decreasing the risk of collusion than the 3-0 point system. Most important, when banning draws, FIFA would introduce new problematic situations of possible collusion where a team may decide to eliminate another team by deliberately losing the penalty shootout (these would be more likely with the 3-0 point system).
The fact that there will be 16 groups of three makes the risk of collusion in at least one group very high, even in the most favorable case where all groups are strongly imbalanced and in every group Team A is the a priori strongest team in the group. Our arguments shows that the introduction of groups of three is a terrible step back in the history of the World Cup. Not only it makes the “disgrace of Gijón” possible again, but it makes the risk of its repetition very high. Of course, not all teams would collude if given the opportunity, but even risk of match fixing may seriously tarnish the World Cup, as unpredictability of the outcome is fundamental to its popularity, and to sport’s popularity in general.
Therefore, we have also described practical alternate formats for a 48-team World Cup that would eliminate or strongly decrease the risk of collusion, with groups of three, four, or six teams.
Actually, whatever the rule that FIFA will use to rank the teams in a group of three, where only the group winner and the runner-up advance to the next phase, there will always be situations where Team A, the team that plays the first two group games, is neither qualified nor eliminated after Match 2, e.g., if A has one 1-0 win and one 2-0 loss. In these situations, some results of Match 3 will qualify Team A and others will eliminate it, raising the risk of collusion between Teams B and C to eliminate Team A. As a consequence, if FIFA wants to keep groups of three with the best two teams advancing, Format 5 of Section 9 seems the best solution to minimize the risk of collusion, where the knockout bracket is seeded based on performance across groups; see also Guyon (2018b).
It is FIFA’s responsibility to build a fair World Cup. It is not too late for FIFA to review the format of the 2026 World Cup. Let us encourage the FIFA Council to realize the danger posed by groups of three, and, if it really wants a 48-team World Cup, opt for one of the formats described in Section 9.
Acknowledgments
We are grateful to the two anonymous referees for their useful comments which helped improve this article.
References
1 | Adler, I. , Cao, Y. , Karp, R. , Pekoz, E. and Ross, S. , (2017) , Random knockout tournaments, Operations Research 65: (6), 1589–1596. |
2 | Annis, D. H. and Wu, S. S. , (2006) , A comparison of potential playoff systems for NCAA I-A football, The American Statistician 60: (2), 151–157. |
3 | Apesteguia, J. and Palacios-Huerta, I. , (2010) , Psychological pressure in competitive environments: Evidence from a randomized natural experiment, American Economic Review 100: (5), 2548–2564. |
4 | Appleton, D. R. , (1995) , May the best man win? Journal of the Royal Statistical Society: Series D (The Statistician) 44: (4), 529–538. |
5 | Aziz, H. , Gaspers, S. , Mackenzie, S. , Mattei, N. , Stursberg, P. and Walsh, T. , (2014) , Fixing a balanced knockout tournament, Proceedings of the Twenty-Eighth AAAI Conference on Artificial Intelligence (AAAI-14), 552-558. |
6 | Baumann, R. , Matheson, V. A. and Howe, C. A. , (2010) , Anomalies in tournament design: The madness of March Madness, Journal of Quantitative Analysis in Sports 6: (2), Article 4. |
7 | BBC: World Cup 2018: Japan go through but final group game ends in ‘mind-boggling farce’. June 28, 2018. Available at www.bbc.com/sport/football/44649668. |
8 | Brams, S. J. and Ismail, M. S. , (2018) , Making the rules of sports fairer, SIAM Review 60: (1), 181–202. |
9 | Chater, M. , Arrondel, L. , Gayant, J.-P. and Laslier, J.-F. , (2018) , Fixing match-fixing. Manuscript. arXiv: 1810.09782. |
10 | Csató, L. , (2018) , Was Zidane honest or well-informed? How UEFA barely avoided a serious scandal, Economics Bulletin 38: (1), 152–158. |
11 | Csató, L. , (2018) , When neither team wants to win: a flaw of recent UEFA qualification rules. Preprint. Available at arxiv.org/pdf/1806.08578.pdf |
12 | Csató, L. , On the design of multi-stage tournaments when some results are carried over. Manuscript. arXiv: 1712.04183. |
13 | Csató, L. , A simulation comparison of tournament designs for the World Men’s Handball Championships. International Transactions in Operational Research, in press. DOI: 10.1111/itor.12691 |
14 | Csató, L. , (2019) , UEFA Champions League entry has not satisfied strategyproofness in three seasons, Journal of Sports Economics 20: (7), 975–981. |
15 | Dagaev, D. and Sonin, K. , (2018) , Winning by losing: Incentive incompatibility in multiple qualifiers, Journal of Sports Economics 19: (8), 1122–1146. |
16 | Dagaev, D. and Rudyak, V. , (2019) , Seeding the UEFA Champions League participants: Evaluation of the reform, Journal of Quantitative Analysis in Sports 15: (2), 129–140. |
17 | Edwards, C. T. , (1998) , Non-parametric procedure for knockout tournaments, Journal of Applied Statistics 25: , 375–385. |
18 | FIFA press release: Unanimous decision expands FIFA World Cup to 48 teams from 2026. Available at https://www.fifa.com/about-fifa/news/y=2017/m=1/news=fifa-council-unanimously-decides-on-expansion-of-the-fifa-world-cuptm–2863100.html. |
19 | Glickman, M. E. , (2008) , Bayesian locally optimal design of knockout tournaments, Journal of Statistical Planning and Inference 138: (7), 2117–2127. |
20 | Glickman, M. E. and Hennessy, J. , (2016) , Bayesian optimal design of fixed knockout tournament brackets, Journal of Quantitative Analysis in Sports 12: (1), 1–15. |
21 | Goossens, D. R. , Beliën, J. and Spieksma, F. C. R. , (2012) , Comparing league formats with respect to match importance in Belgian football, Annals of Operations Research 194: (1), 223–240. |
22 | Guyon, J. , (2014) , Rethinking the FIFA World Cup final draw. Preprint, available at ssrn.com/abstract=2424376. |
23 | Guyon, J. , (2015) , Rethinking the FIFA World Cup final draw, Journal of Quantitative Analysis in Sports 11: (3), 169–182. |
24 | Guyon, J. , (2018) , Why Groups of 3 Will Ruin the World Cup (So Enjoy This One). The New York Times, June 11. Available at https://www.nytimes.com/2018/06/11/upshot/why-groups-of-3-will-ruin-the-world-cup-so-enjoy-this-one.html |
25 | Guyon, J. and Monkovic, T. , (2018) , FIFA, We Fixed Your World Cup Collusion Problem for You. The New York Times, June 26. Available at https://www.nytimes.com/2018/06/26/upshot/world-cup-fifa-collusion-readers.html |
26 | Guyon, J. , (2018) , What a fairer team UEFA Euro could look like, Journal of Sports Analytics 4: (4), 297–317. |
27 | Kendall, G. and Lenten, L. , (2017) , When sports rules go awry, European Journal of Operational Research 257: (2), 377–394. |
28 | Krumer, A. and Lechner, M. , (2017) , First in first win: Evidence on schedule effects in round-robin tournaments in mega-events, European Economic Review 100: , 412–427. |
29 | Krumer, A. , Megidish, R. and Sela, A. , (2017) , First-mover advantage in round-robin tournaments, Social Choice and Welfare 48: (3), 633–658. |
30 | Krumer, A. , Megidish, R. and Sela, A. , (2019) , The optimal design of round-robin tournaments with three players. To appear in Journal of Scheduling. |
31 | Laliena, P. and López, F. J. , (2019) , Fair draws for group rounds in sport tournaments, International Transactions in Operational Research 26: (2), 439–457. |
32 | Lasek, J. and Gagolewski, M. , (2018) , The efficacy of league formats in ranking teams, Statistical Modelling 18: (5-6), 411–435. |
33 | Marchand, E. , (2002) , On the comparison between standard and random knockout tournaments, The Statistician 51: , 169–178. |
34 | McGarry, T. and Schutz, R. W. , (1997) , Efficacy of traditional sport tournament structures, Journal of the Operational Research Society 48: (1), 65–74. |
35 | Palacios-Huerta, I. , (2012) , Tournaments, fairness and the Prouhet-Thue-Morse sequence, Economic Inquiry 50: (3), 848–849. |
36 | Palacios-Huerta, I. , (2014) , Beautiful game theory: How soccer can help economics. Princeton University Press, Princeton, New York. |
37 | Palacios-Huerta, I. , (2018) , Penalties for Fair Play. New Scientist, June 30. |
38 | Ross, S. and Ghamami, S. , (2008) , Efficient simulation of a random knockout tournament, Journal of Industrial and Systems Engineering 2: (2), 88–96. |
39 | Sahm, M. , (2019) , Are sequential round-robin tournaments discriminatory? Journal of Public Economic Theory 21: (1), 44–61. |
40 | Scarf, P. , Yusof, M. M. and Bilbao, M. , (2011) , A numerical study of designs for sporting contests, European Journal of Operational Research 198: (1), 190–198. |
41 | Scarf, P. A. and Yusof, M. M. , (2011) , A numerical study of tournament structure and seeding policy for the soccer World Cup Finals, Statistica Neerlandica 65: (1), 43–57. |
42 | Stanton, I. and Vassilevska Williams, V. , (2011) , Rigging tournament brackets for weaker players, Proceedings of the 22nd International Joint Conference on Artificial Intelligence (IJCAI), 357-364. |
43 | The Daily Mail: “World Cup madness: 48 countries, 16 groups (yes, that’s 3 teams in each) and penalty shoot-outs in group matches... FIFA chiefs vote for bloated new format”. January 10, 2017. Accessed on May 23, 2018. Available at http://www.dailymail.co.uk/sport/sportsnews/article-4104944/FIFA-announce-48-team-World-Cup-start-2026-idea-receives-unanimous-approval.html |
44 | The Guardian: Denmark join France in last 16 after first goalless draw of World Cup. June 26, 2018. Accessed on April 21, 2019. Available at https://www.theguardian.com/football/2018/jun/26/denmark-france-world-cup-group-c-match-report |
45 | The Independent: Radamel Falcao makes revealing admission following match-fixing allegations in Peru vs Colombia draw. October 12, 2017. Available at www.independent.co.uk/sport/football/international/radamel-falcao-match-fixing-colombia-peru-draw-world-cup-southamerica-qualifying-renato-tapia-a7996226.html. |
46 | The New York Times: FIFA to Expand World Cup to 48 Teams in 2026. Januaty 10, 2017. Available at www.nytimes.com/2017/01/10/sports/fifa-world-cup.html. |
47 | The Sun: “So Obviously Fixed” World Cup 2018: France and Denmark spark “fix” claims on social media after first 0-0 draw of the tournament. June 27, 2018. Accessed on April 21, 2019. Available at https://www.thesun.co.uk/world-cup-2018/6631385/france-denmark-world-cup-2018-fix-social-media |
48 | Truta, T. M. , (2018) , FIFA does it right: 2026 FIFA World Cup does not increase the number of non-competitive matches. Manuscript. arXiv: 1808.05858. |
49 | Vassilevska Williams, V. , (2010) , Fixing a tournament, Proceedings of the 24th AAAI Conference on Artificial Intelligence (AAAI), 895-900. |
50 | Vong, A. I. , (2017) , Strategic manipulation in tournament games, Games and Economic Behavior 102: , 562–567. |
51 | Vu, T. , Altman, A. and Shoham, Y. , (2009) , On the complexity of schedule control problems for knockout tournaments, Proceedings of the 8th International Joint Conference on Autonomous Agents and Multi-Agent Systems (AAMAS), 225-232. |
52 | Wikipedia: List of most-watched television broadcasts. Available at https://en.wikipedia.org/wiki/List_of_most-watched_television broadcasts. Accessed in 2018. |
53 | World Soccer: “Penalty shootouts may be used to settle drawn World Cup matches”. January 18, 2017. Accessed on May 23, 2018. Available at http://www.worldsoccer.com/news/penalty-shootouts-may-be-used-to-settle-drawn-world-cup-matches-394315 |
Notes
1 The 1982 World Cup used groups of three in the second round, where only the group winner advanced to the final knockout stage.
2 Note that weirdly, among other oddities of the 1954 FIFA World Cup format, it had group winners playing against other group winners and runners-up playing against other runners-up in quarterfinals.
3 A more complicated model could have the probabilities pXY depend on the match schedule. Note that, ignoring collusion issues, Krumer and Lechner (2017) have examined the role of the schedule in round-robin tournaments with sequential games between three and four contestants empirically. Theoretical works on this topic include Krumer, Megidish, and Sela (2017) and Sahm (2019).
4 The order of the first two games is irrelevant as regards the risk of collusion.
5 For this reason we disagree with the approaches based on the results of previous World Cups, such as Truta (2018).
6 Note that the extensive use of penalty shootouts for deciding draws may lead to the emergence of other fairness issues (Apesteguia and Palacios-Huerta, 2010; Brams and Ismail, 2018; Palacios-Huerta, 2012, 2014).
7 The number of matches could be slightly decreased if only the eight group winners of the second group stage qualify for the quarterfinals. Then there would be only eight matches in the knockout stage, and the maximal number of matches per team would be reduced to eight from nine. The format G64, which was used in the 2003 World (Wo)Men’s Handball Championship, contained groups of four teams such that only the first advanced to the knockout stage (Csató, 2019b).

