
Video-Based Automated Assessment of Movement Parameters Consistent with MDS-UPDRS III in Parkinson’s Disease
Abstract
Background:
Among motor symptoms of Parkinson’s disease (PD), including rigidity and resting tremor, bradykinesia is a mandatory feature to define the parkinsonian syndrome. MDS-UPDRS III is the worldwide reference scale to evaluate the parkinsonian motor impairment, especially bradykinesia. However, MDS-UPDRS III is an agent-based score making reproducible measurements and follow-up challenging.
Objective:
Using a deep learning approach, we developed a tool to compute an objective score of bradykinesia based on the guidelines of the gold-standard MDS-UPDRS III.
Methods:
We adapted and applied two deep learning algorithms to detect a two-dimensional (2D) skeleton of the hand composed of 21 predefined points, and transposed it into a three-dimensional (3D) skeleton for a large database of videos of parkinsonian patients performing MDS-UPDRS III protocols acquired in the Movement Disorder unit of Avicenne University Hospital.
Results:
We developed a 2D and 3D automated analysis tool to study the evolution of several key parameters during the protocol repetitions of the MDS-UPDRS III. Scores from 2D automated analysis showed a significant correlation with gold-standard ratings of MDS-UPDRS III, measured with coefficients of determination for the tapping (0.609) and hand movements (0.701) protocols using decision tree algorithms. The individual correlations of the different parameters measured with MDS-UPDRS III scores carry meaningful information and are consistent with MDS-UPDRS III guidelines.
Conclusion:
We developed a deep learning-based tool to precisely analyze movement parameters allowing to reliably score bradykinesia for parkinsonian patients in a MDS-UPDRS manner.
INTRODUCTION
The diagnosis of Parkinson’s disease (PD) is based on the presence of a parkinsonian syndrome, i.e., the association of rigidity and/or rest tremor to bradykinesia, this latter being mandatory for the diagnosis [1]. Bradykinesia is defined as a motor slowness associated with a decrease in the amplitude and/or speed of movement [2–4]. Currently, the evaluation of motor impairment of PD is based on part III (motor) of the Movement Disorder Society-Unified Parkinson’s Disease Rating Scale (MDS-UPDRS) composed of 18 items rated from 0 (normal) to 4 (severe), which assess the severity of bradykinesia, rigidity and tremor [5, 6]. This score is used worldwide for patient follow-up in outpatient clinics but also in clinical research and more specifically in therapeutic trials. However, the semi-quantitative assessment of parkinsonian symptoms by the MDS-UPDRS III score suffers from a certain subjectivity and the reproducibility of the measurements arising from assessors is questionable especially in case of non-parkinsonian expertise [7–13]. This may contribute to the difficulty in the follow-up of PD patients and also to induce some biases in clinical research due to the multiplicity of assessors and clinical centers, and variability across longitudinal iterative visits.
Although digital tools have been recently developed in an attempt to improve bradykinesia scoring by providing quantitative measures [14–16], they exhibit limited use in practice because they rely on wearable sensors on patients [17, 18] in a dedicated room or need specific conditions [15, 18–20]. More recent studies aimed to circumvent these material issues by developing video-based only tools [12, 21–24]. First, machine learning-based automatic rating for rest tremor and finger tapping was investigated to measure bradykinesia [12]. The authors showed that it was feasible, reliable when compared to movement disorders specialist ratings, and more accurate than a non-trained one. The analysis was based on the periodicity of the repeating task videotaped, i.e., the frequency of the movement, to predict a severity score, but the outcomes did not fully reflect the MDS-UPDRS guidelines in which decreases in speed and amplitude of movement over time were also considered [12]. The global PD severity was assessed by applying deep learning approach to automatically score the severity level by compiling 7 of the 18 items of the MDS-UPDRS III [22]. MDS-UPDRS III bradykinesia was investigated for upper limbs tasks but with the constraint of fixed webcam recordings and with different assessment guidelines from MDS-UPDRS [21, 22]. In the same way, Guo et al. [25] demonstrated that a computer-vision approach to obtain finger tapping 3D acquisition is feasible in patients with PD. Such approaches have also been developed to successfully study gait of parkinsonian patients [23, 24]. Although these studies bring interesting approaches, tools still need to be developed to establish metrics closer to the MDS-UPDRS III guidelines for a better assessment over time of movement parameters of bradykinesia.
In this emerging context of computer-based tools and given the importance of bradykinesia evaluation in the PD diagnosis, we developed a tool based on hand-pose estimation and movement analysis to compute an objective score of bradykinesia with multiple medically-relevant parameters using a deep learning approach in accordance with MDS-UPDRS III guidelines [26].
MATERIALS AND METHODS
Participants and videos
We included only PD patients according to MDS clinical criteria [1], with the exception of one MSA patient [27] and another one with undetermined atypical parkinsonian syndrome. All patients were consecutively seen in an outpatient clinic by a movement disorder specialist (BD) at Avicenne University Hospital between June 2019 and December 2020. All patients were video-recorded, using standard smartphones (rescaled to 720×1280 pixels with 30 or 60 fps), for the items 3.4, 3.5, and 3.6 of the MDS-UPDRS III corresponding to the assessment of finger tapping, hand movements, and pronation-supination movements of the hands, respectively.
The videos were then stored in a secure database, according to the French data protection authority (Commission Nationale de l’Informatique et des Libertés) recommendations. All participants gave their written informed consents for videos and their analyses. The study was approved by the local ethics committee (CLEA-2019-83) and registered in ClinicalTrials.gov (NCT04974034).
MDS-UPDRS III ratings of the video recordings
Two movement disorders specialists certified for MDS-UPDRS (BD, MM) and three neurologists trained for movement disorders, but not certified for MDS-UPDRS scoring (CD, QS and BG), rated all the videos for both hands according to the items 3.4, 3.5, and 3.6 of the MDS-UPDRS III [5]. Assessors were blinded to the ON or OFF state of patients.
The python package pinguin was used to compute the Intraclass Correlation Coefficient (ICC), with options nan_policy = ’omit’. ICC values below 0.50, between 0.50 and 0.75, between 0.75 and 0.90 and above 0.90 are considered as poor, moderate, good, and excellent, respectively.
Hand-pose estimation using deep learning algorithms
We analyzed videos using two deep learning algorithms in order to extract interesting temporal features of the movement. We used a first network, DeepLabCut [26], to extract predefined points of interest in 2D from images. Using an associated software (https://www.mackenziemathislab.org/deeplabcut), we roughly labelled 5 images per video with 22 different points (5 for each finger, one for the wrist, one for the center of the palm) and the network was trained to detect the 22 joints [28] using the DeepLabCut toolbox. After the 2D hand coordinates detection, several algorithms (see next section) were applied to filter and smooth the movement trajectories. We defined a bounding box around the patient’s hand from the 2D coordinates obtained with DeepLabCut for each timestep, and each frame was cropped along this box. The cropped image was processed through a second network, HandGraphCNN [29], which without specific training predicted 2D and 3D positions of the 21 points (all the previous ones, except center of palm). We then processed and analyzed all trajectories (2D DeepLabCut, 2D & 3D HandGraphCNN) to study the temporal evolution of the movement for each protocol. We realized training and inference using Python 3.X, tensorflow and Pytorch on a GPU Nvidia Geforce GTX 1080 Ti. The deep-learning algorithms inferred the positions of the hand points frame by frame, and the detection was achieved correctly for a large majority of the frames. However, sometimes the hand position was not correctly inferred for a single frame, usually at unrealistic coordinates. We detected and excluded such outliers in our analysis.
Processing of 2D and 3D coordinates
The 2D trajectories extracted from DeepLabCut went through different post-processing processes: (i) using an iterative algorithm, outlier points, where the speed of movement was above a defined threshold, were deleted; (ii) using the score maps for each point given by DeepLabCut, we took out all coordinates for which the probability was below a defined threshold (fixed at p = 0.8); (iii) the trace was smoothed using a Savitzky-Golay filter (with parameters window_length = 11, polyorder = 5) from the scipy library. For (i) and (ii), we used linear interpolation to infer the coordinates of deleted points, with numpy interp function.
For the 2D and 3D coordinates from HandGraphCNN, we reproduced step (i) and (iii) of the post-processing algorithm.
Analysis of bradykinesia protocols using 2D and 3D coordinates
Using the 2D and 3D trajectories, we computed different metrics, specific for each protocol in order to evaluate bradykinesia symptoms as recommended by the MDS-UPDRS III guidelines.
1 Finger tapping (using 2D and 3D hand-pose estimation): distance between the thumb and index fingers tips.
2 Hand movements (using 2D and 3D hand-pose estimation): averaged distance between each finger tip and the wrist point.
3 Pronation-supination movements of the hands (using only 3D hand-pose estimation since we need to measure angle): azimuthal angle from spherical coordinates of the tip of the thumb (computed with z-axis being the line between wrist and start of the third finger).
Each parameter was evaluated for all timesteps, smoothed using a Savitzky-Golay filter (with parameters window_length = 9, polyorder = 3) and then normalized between 0 and 1. Speed (in each direction) was also computed, smoothed using a Savitzky-Golay filter (with parameters window_length = 5, polyorder = 3) and normalized between –1 and 1.
The temporal evolution of the parameters was periodic because the protocols consisted of 10 repetitions of each movement. We used an algorithm based on scipy.signal find_peaks function to detect the 10 repetitions. Note that we restricted the analysis to the 9 repetitions that were clearly detectable and which did not depend on the initial position of the hand, since the aim was to study the whole dynamics of each sweep. The frequency F of the repetitions was measured. These 9 sweeps were analyzed individually and the following properties were computed: (i) duration of the sweep (noted Tsweep [i] for each sweep i); (ii) amplitude of the sweep (maximum minus minimum values) (noted Asweep); (iii) speed (amplitude divided by duration, noted Ssweep). The three first/last sweeps properties were compared to study if the movement was slowed down or altered in any way during the protocol, i.e., we computed
A fatigue parameter was also computed,
L represents the maximal change in amplitude during the whole protocol, i.e., all the repetitions from 1 to 9.
To compute the deviation from a periodic trajectory, we fitted the following function on each trace, using the lmfit package:
From these fitted parameters, we computed:
• The period variation, which represents the change in period computed from the fit parameters,
• The amplitude variation during the 9 sweeps, which represents the change in amplitude computed from the fit parameters,
We used 7 parameters (F, ΔTsweep, ΔAsweep, ΔSsweep, ΔTfit, ΔAfit, L) for correlation with MDS-UPDRS III scores.
Videos were discarded for three reasons: (i) the algorithms DeepLabCut or HandGraphCNN failed to perform hand-pose estimation, the automated analysis failed (ii) to detect 9 sweeps or (iii) do the fitting procedure. Overall, 67% (64/96) of the videos for the tapping finger, 83% (78/94) for the hand movements, 43% (35/82) for the pronation-supination movements were used for further analysis.
Impact of the measured parameters for MDS-UPDRS scoring using statistical learning algorithms
To evaluate the impact of the measured parameters for MDS-UPDRS scoring, three classical algorithms of machine learning were tested: (i) the linear regression, (ii) the decision tree with max_depth = 2 and (iii) the decision tree with max_depth = 3, all from the scikit-learn toolbox. We trained these algorithms on the task of predicting the averaged MDS-UPDRS III score, from the 7 previously defined parameters, for each protocol.
The coefficient of determination after training was computed with correct labels. Concurrently, we estimated the distribution of coefficients of determination obtained when training the algorithm on shuffled MDS-UPDRS III scores: we computed the mean and standard deviation on 100 different shuffles, and approximated them with a normal distribution. Using this control distribution, we estimated the probability pshuffle that trained networks with shuffled scores had higher coefficients of determination than the one obtained with the correct MDS-UPDRS scores. We used pshuffle to study the significance of the predictions (*pshuffle< 0.05, **pshuffle< 0.005, ***pshuffle< 0.0005).
Individual correlations were computed between the averaged MDS-UPDRS III scores and the 7 different parameters computed in the previous section, using scipy.stats linregress and spearmanr functions. Slopes and p-values are extracted for each case. Results with p < 0.05 were considered statistically significant (*p < 0.05, **p < 0.005, ***p < 0.0005).
RESULTS
Demographic features
Among the 36 parkinsonian patients, 34 patients had a confirmed PD diagnosis according to MDS clinical criteria, 2 of them having a genetic form [1] (Supplementary Table 1). Patients assessment was carried out without considering the last dopamine intake in order to record a panel of patients in a wide range of parkinsonian state. We also recruited 11 healthy individuals, without any known neurological condition, to assess bradykinesia in a priori non-parkinsonian subjects.
Unreliability of MDS-UPDRS III scoring for bradykinesia
Five neurologists were asked to blindly score N = 272 videos from PD and non-PD subjects performing with both hands the 3.4, 3.5, and 3.6 items of the MDS-UPDRS III. Comparing the different scores and analyzing their distribution for each video led to the conclusion that in the majority cases, the five examiners did not give the same scores. We also computed the standard deviation of the scores for each video and plotted its distribution (Fig. 1a). We observed that 58 videos had a null standard deviation, and as such were scored similarly by all five neurologists. When considering the whole dataset, MDS-UPRDS scores had a mean standard deviation of 0.409.
Fig. 1
Unreliability of MDS-UPDRS scores across neurologists’ ratings. a) Histogram of the standard deviations (computed for each video, on the 5 different MDS-UPRS scores); b) videos ranked by the number of different MDS-UPDRS scores given by the physicians, colors for the difference between maximum and minimum scores.
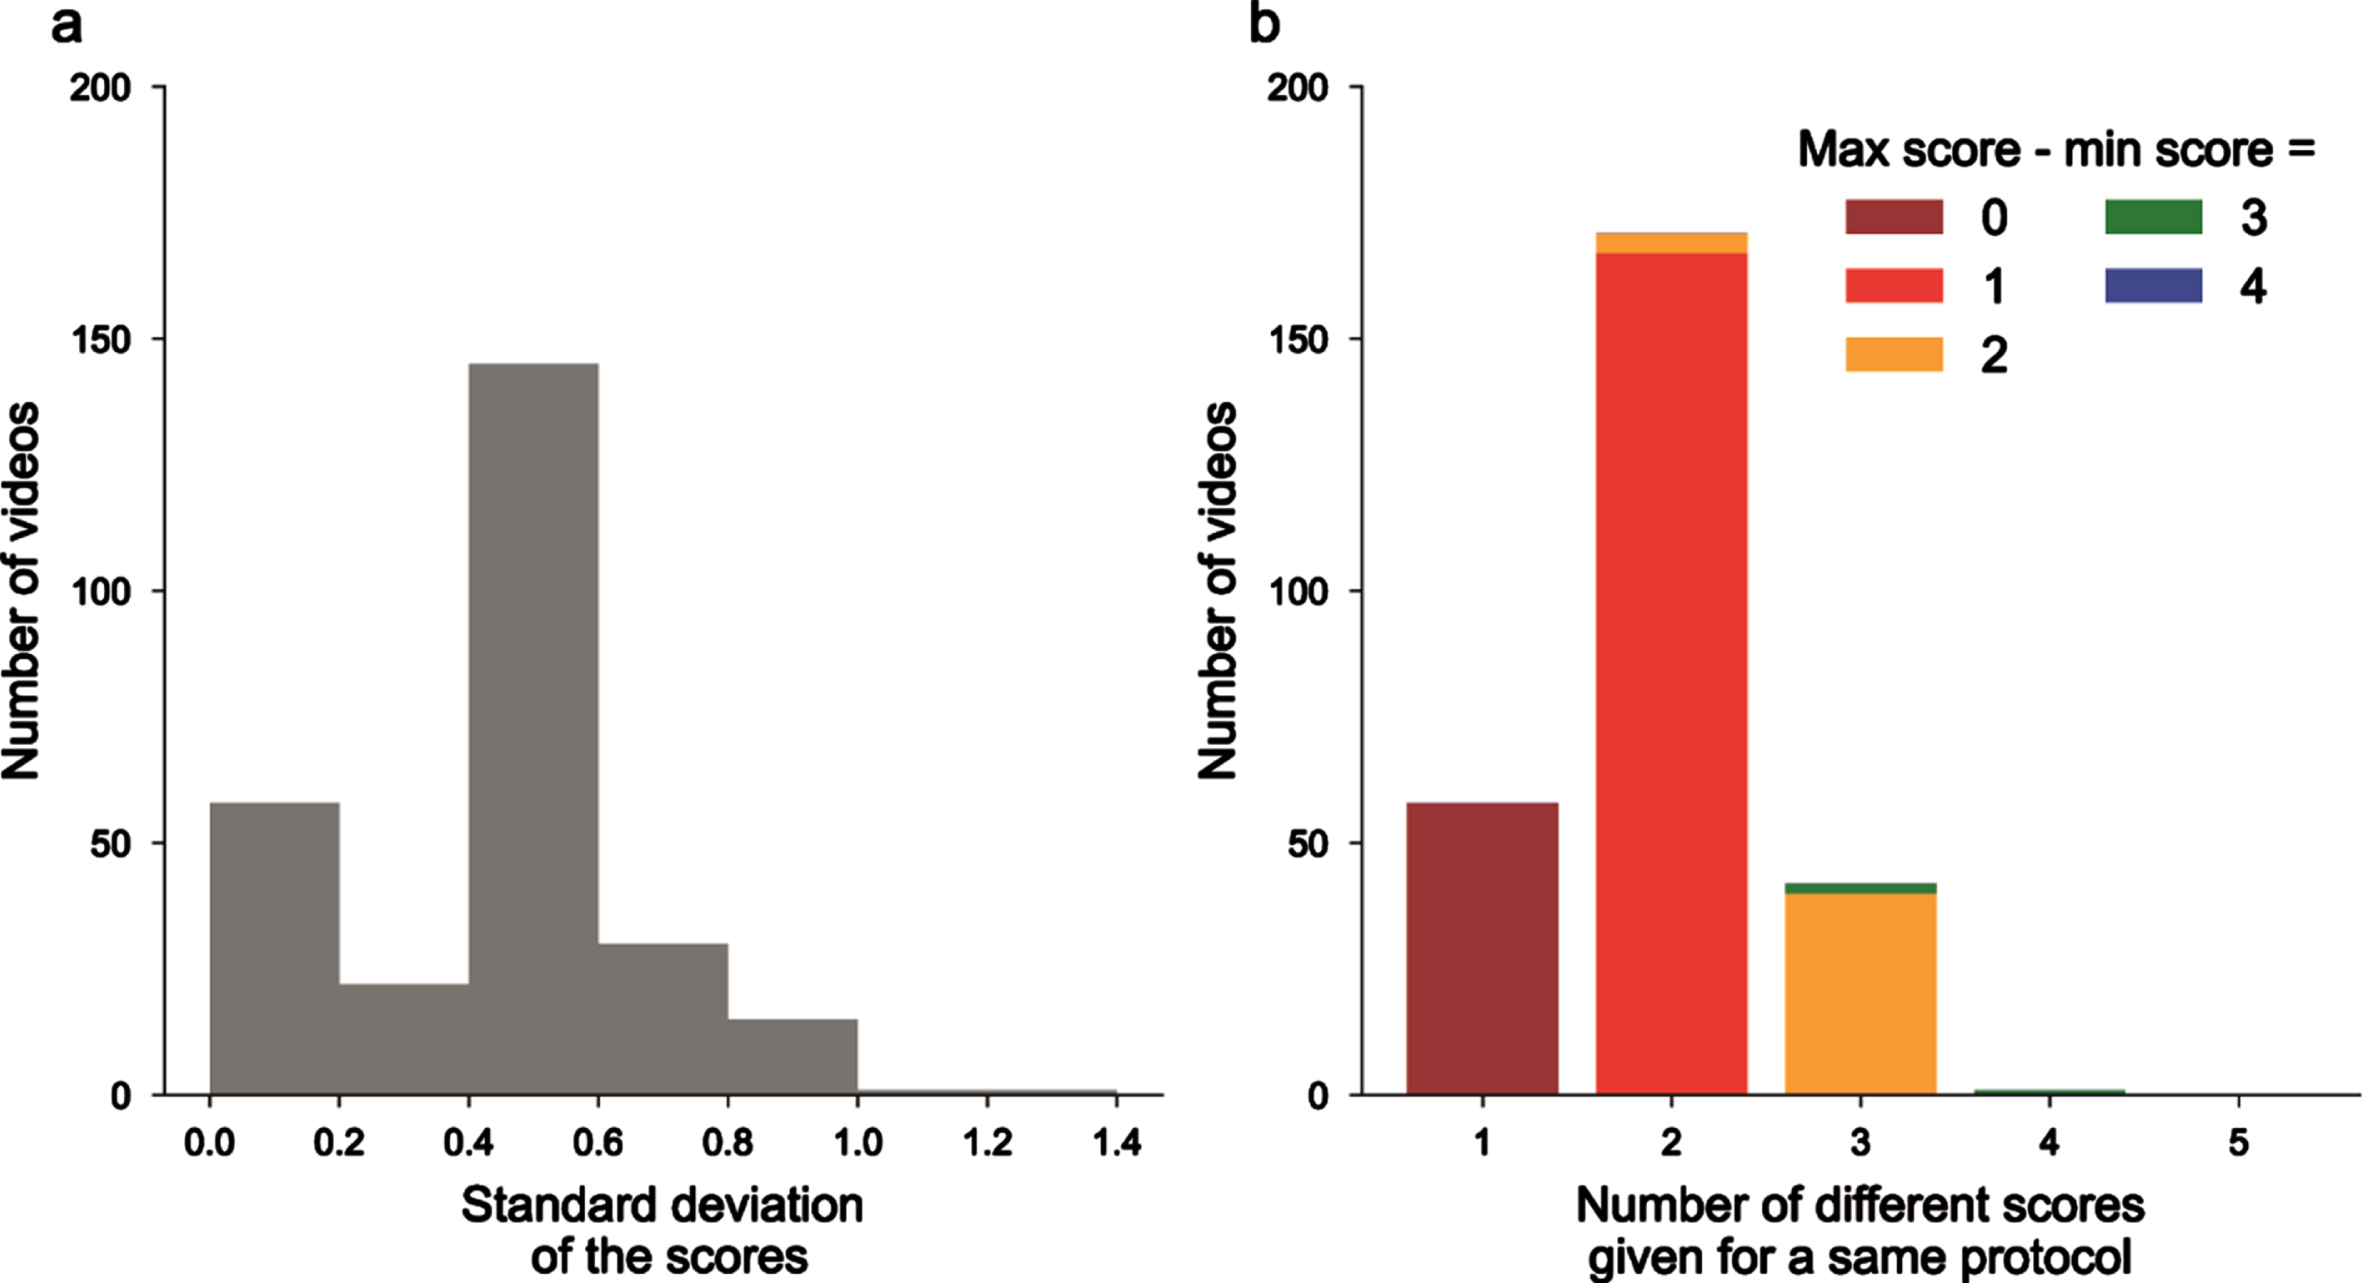
We also gathered videos as a function of the number of different scores that were given by the neurologists, and then in each class on the difference between the maximum and minimum scores (Fig. 1b). 58 videos had the same ratings, 171 with 2 different scores, 42 with 3 different scores and even 1 with 4 different scores given for the same videos (on a total of 5 possible scores from 0 to 4). Overall, this confirms the existence of inter-rater variability for MDS-UPDRS III scoring.
Finally, to assess the reproducibility of measurements between MDS-UPDRS III raters, we measured the ICC. The ICC score was 0.792 (95% confidence interval [0.76, 0.82]) which is defined as good between 0.75 and 0.9, but still showed that the assessors do not exactly rate videos in the same manner. We did not observed difference between the variability of finger tapping, hand movements and pronation-supinations (0.836 [0.79, 0.88]; 0.774 [0.71, 0.83]; 0.763 [0.69, 0.83], respectively).
Extractions of relevant parameters for MDS-UPDRS III scores using deep learning
Using deep learning algorithms (DeepLabCut and HandGraphCNN), we detected 21 important points describing the hands of the patients, and extrapolated their coordinates in 2D and 3D as a function of time (see Materials and Methods). After complex steps of post-processing and analysis, one metric is extracted for each protocol and represented across time. Examples of extracted data in a single patient are presented in Figs. 2–4 for finger tapping, hand movements, and pronation-supination movements of the hands, respectively. For each figure, we present snapshots from the initial videos, with the different skeletons extracted using the two deep learning algorithms (Figs. 2a–4a, blue DeepLabCut 2D, red HandGraphCNN 2D, green HandGraphCNN 3D). From the trajectories of the hand joints, we computed protocol specific metrics (see Materials and Methods) during the whole protocol. As the protocol is composed of 10 repetitions of the same hand movement, for each metric 9 sweeps (delimited by the 10 plain circles on each trajectory, see Figs. 2b1–4b1, left) were detected and then analyzed with the evolution of movement during the protocols. The shapes from the first three sweeps (dotted lines) were compared to the last three ones (plain lines) (Figs. 2b1–4b1, right). Similarly, we computed the associated speed in Figs. 2b2–4b2. The frequency F, fatigue L, relative variation of the period ΔTsweep, amplitude ΔAsweep and speed ΔSsweep accross the protocol were computed and presented in Figs. 2c/2c/4c. More complex variation coefficients, ΔTfit and ΔAfit based on the fit of a periodic function were also obtained (Methods) and represented in Figs. 2c/2c/4c. This innovative analysis of several parameters over time allowed for accurate application of the MDS-UPDRS III item scoring guidelines.
Fig. 2
Video analysis using deep learning algorithms for tapping protocol (associated Supplementary Movie 1). a) Snapshots from the initial videos, with the different skeletons extracted using the two deep learning algorithms (blue DeepLabCut 2D, red HandGraphCNN 2D, green HandGraphCNN 3D). b1, left) Evolution of the distance between the thumb and pinky fingers tips with 9 sweeps (delimited by the 10 plain circles on each trajectory). b1, right) First three sweeps (dotted lines) compared to the last three ones (plain lines). b2) same as (b1) for the speed. c) Frequency F, fatigue L, relative variation of the period ΔTsweep, amplitude ΔAsweep, speed ΔSsweep accross the protocol, more complex variation coefficients, ΔTfit and ΔAfit based on the fit of a periodic function.
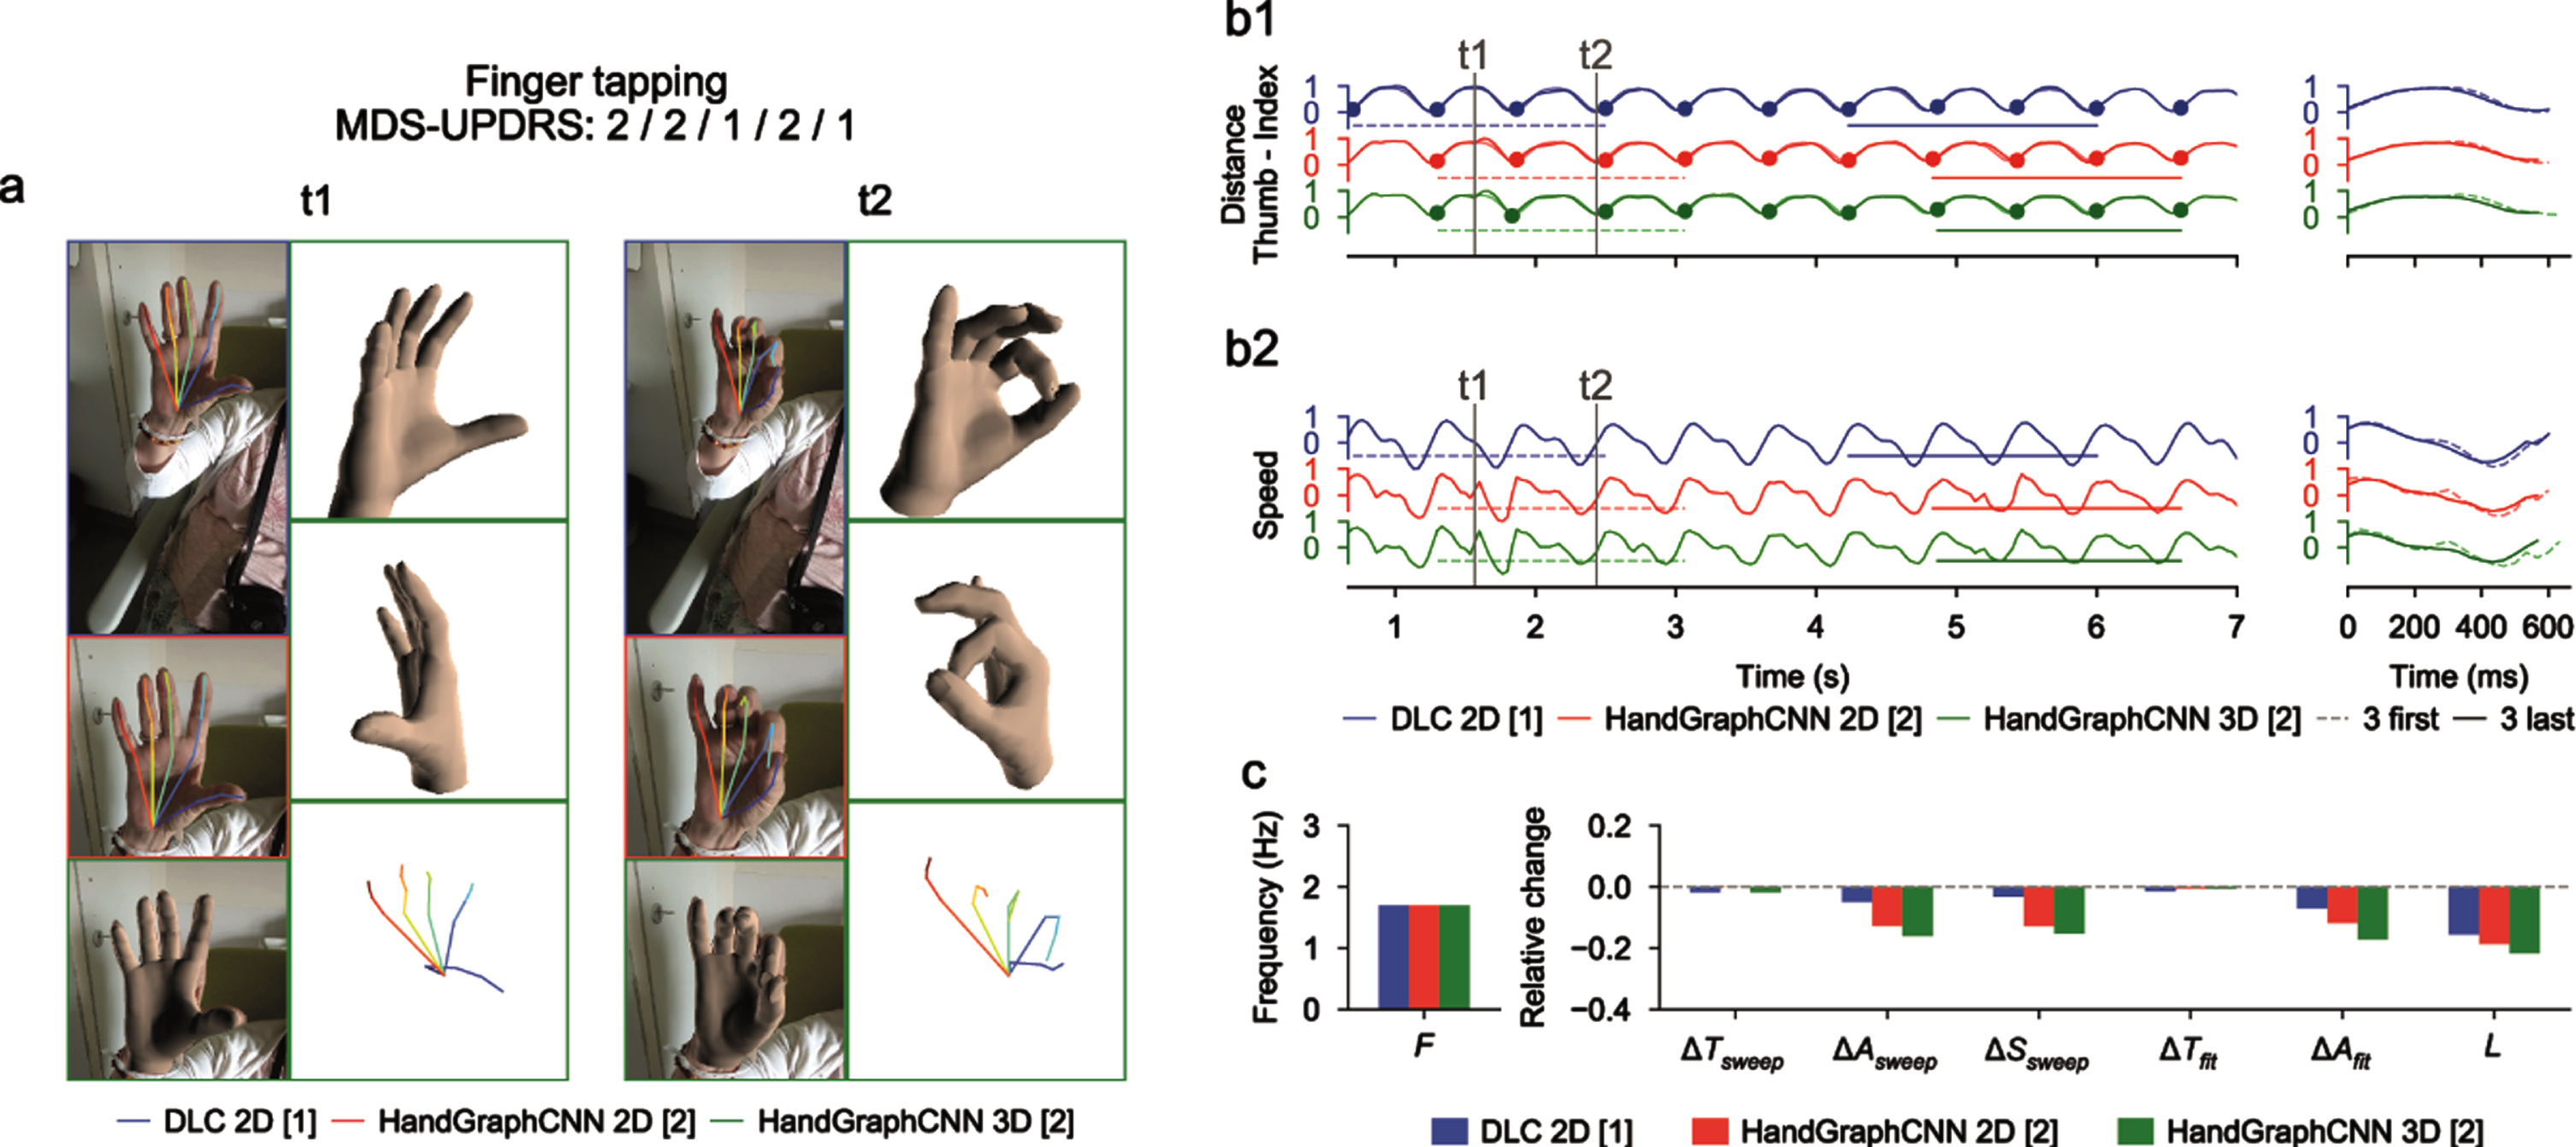
Fig. 3
Video analysis using deep learning algorithms for hand movements protocol (associated Supplementary Movie 2). a) Snapshots from the initial videos, with the different skeletons extracted using the two deep learning algorithms (blue DeepLabCut 2D, red HandGraphCNN 2D, green HandGraphCNN 3D). b1, left) Evolution of the averaged distance between each finger tip and the wrist point with 9 sweeps (delimited by the 10 plain circles on each trajectory). b1, right) First three sweeps (dotted lines) compared to the last three ones (plain lines). b2) same as (b1) for the speed. c) Frequency F, fatigue L, relative variation of the period ΔTsweep, amplitude ΔAsweep, speed ΔSsweep accross the protocol, more complex variation coefficients, ΔTfit and ΔAfit based on the fit of a periodic function.
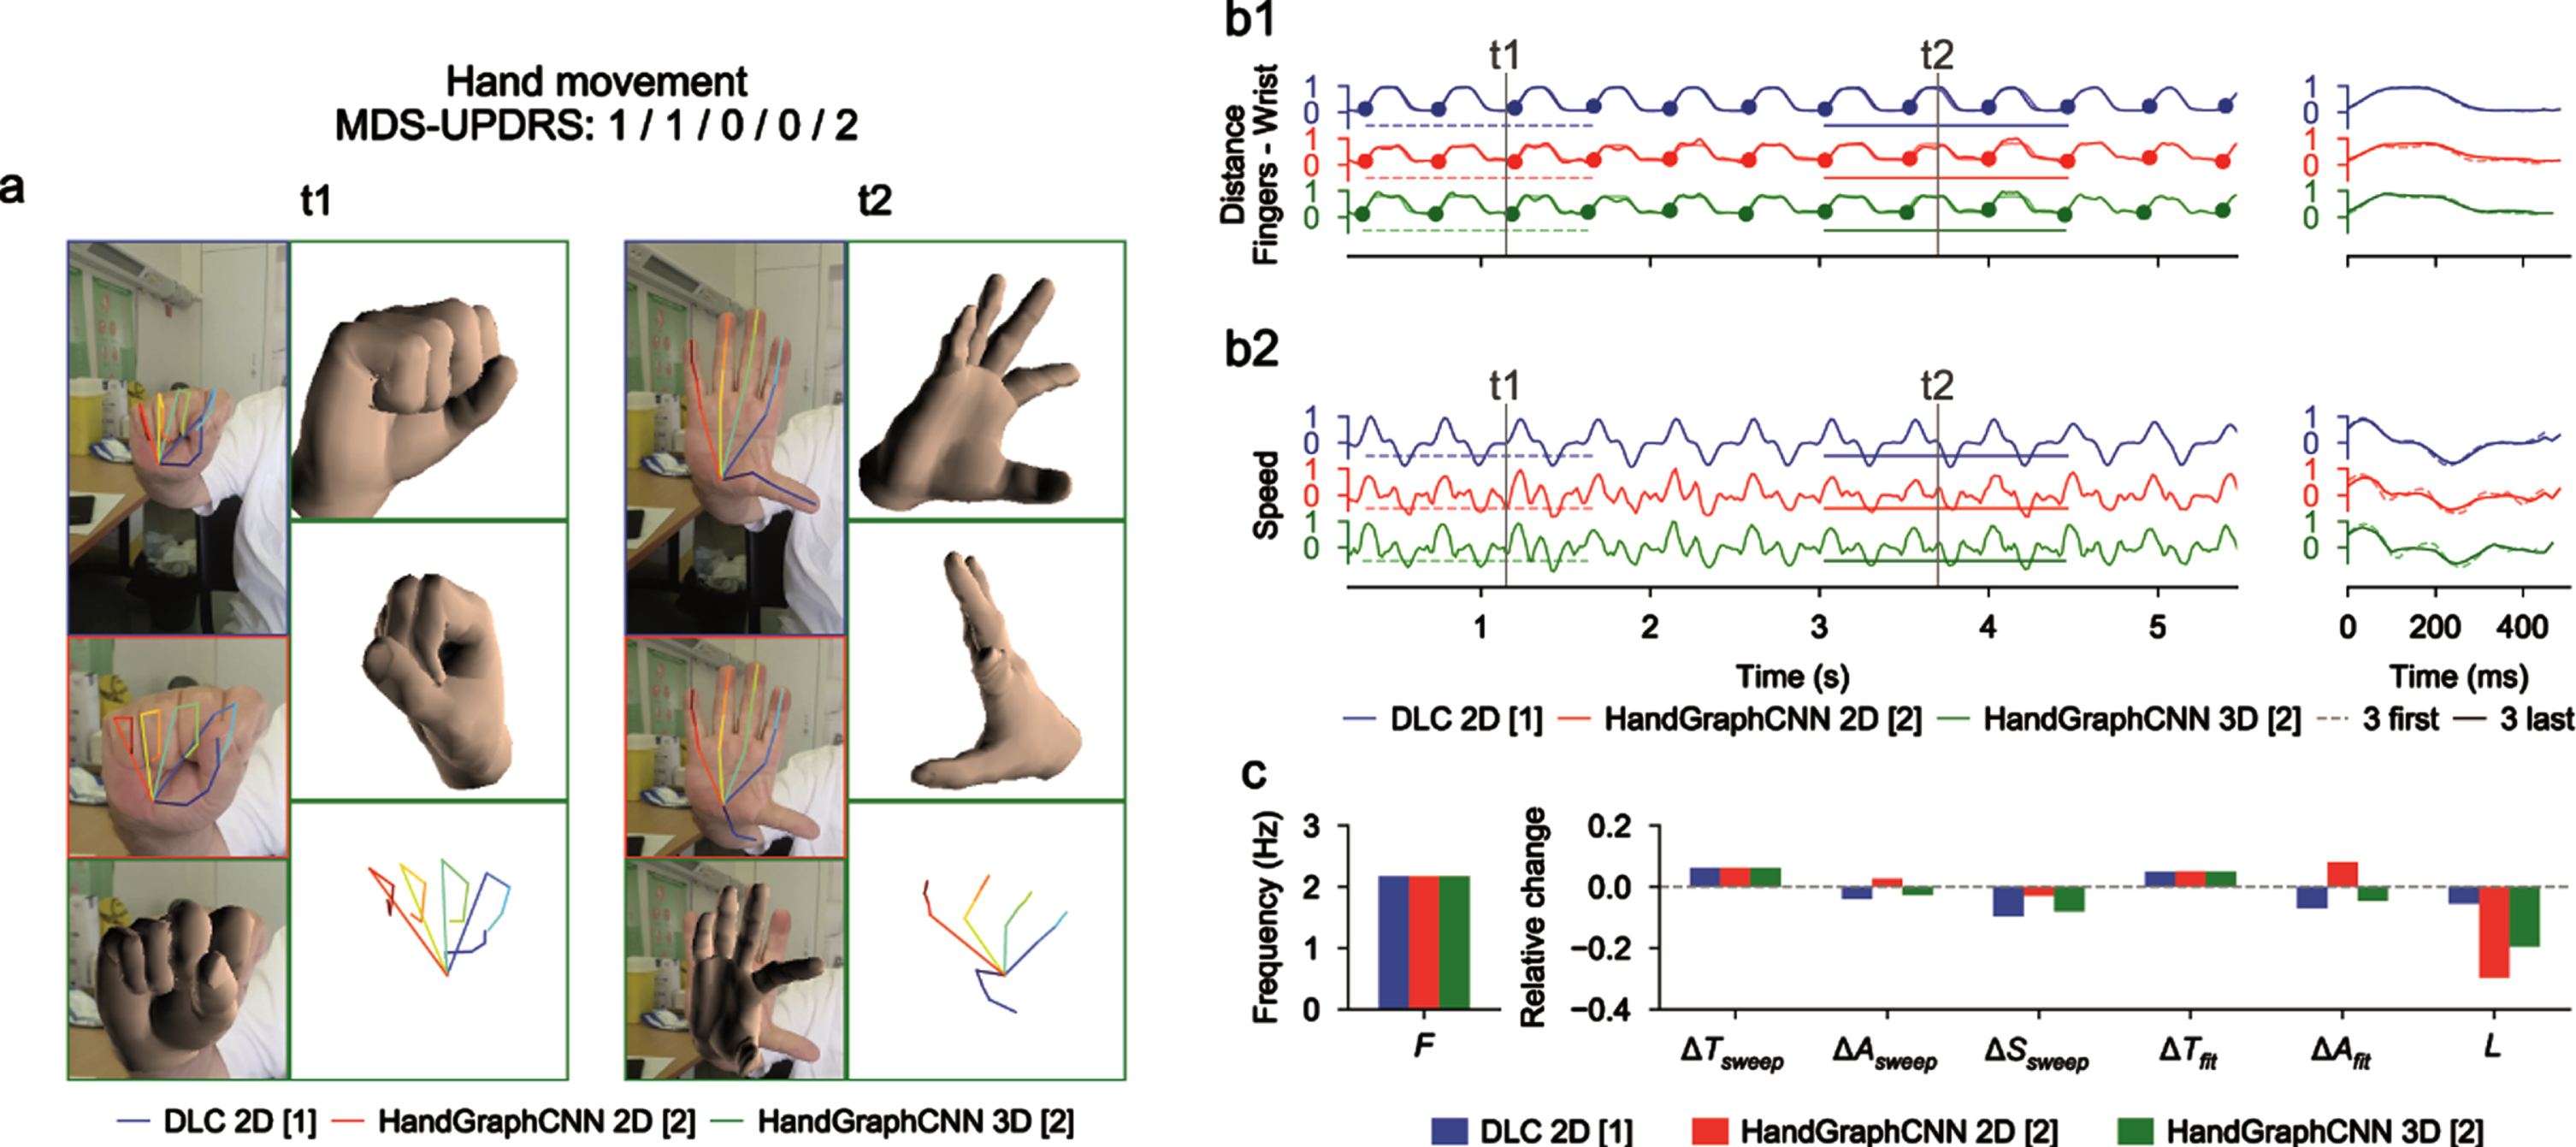
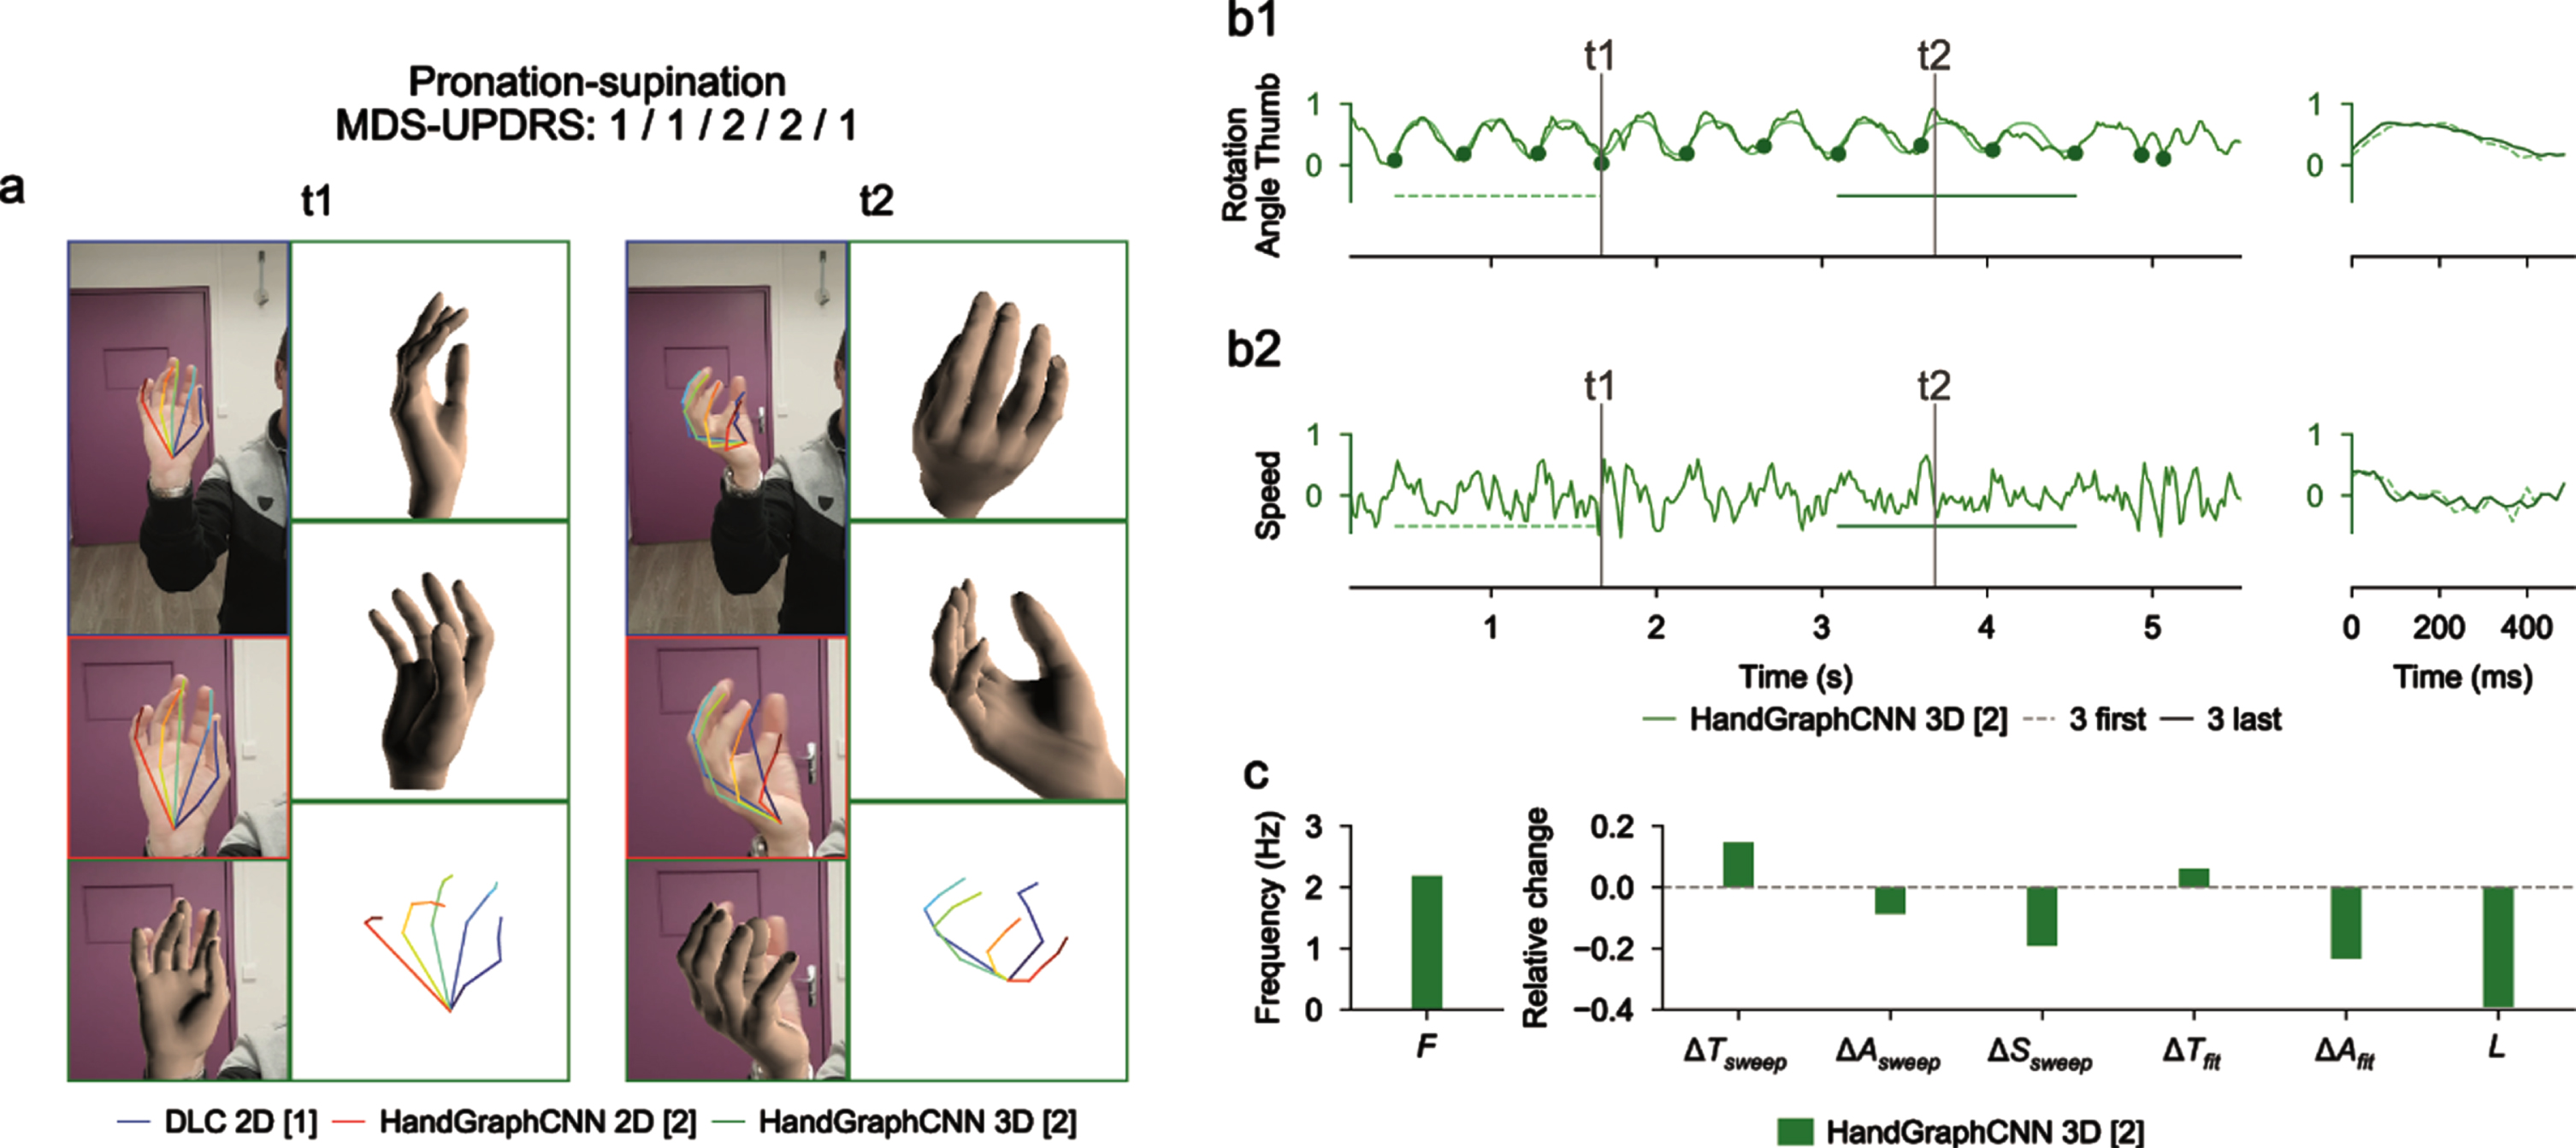
Fig. 4
Video analysis using deep learning algorithms for pronation-supination protocol (associated Supplementary Movie 3). a) Snapshots from the initial videos, with the different skeletons extracted using the two deep learning algorithms (blue DeepLabCut 2D, red HandGraphCNN 2D, green HandGraphCNN 3D). b1, left) Evolution of the azimuthal angle from spherical coordinates of the tip of the thumb with 9 sweeps (delimited by the 10 plain circles on each trajectory). b1, right) First three sweeps (dotted lines) compared to the last three ones (plain lines). b2) same as (b1) for the speed. c) Frequency F, fatigue L, relative variation of the period ΔTsweep, amplitude ΔAsweep, speed ΔSsweep accross the protocol, more complex variation coefficients, ΔTfit and ΔAfit based on the fit of a periodic function.
For the finger tapping protocol (Fig. 2 and Supplementary Movie 1), we computed the distance between the tips of the thumb and the index fingers as the primary metric, and the associated speed. We observed on this example that the trajectories were almost periodic. The analysis showed that, with the three different detection algorithms (Fig. 2: DeepLabCut 2D (blue), HandGraphCNN 2D (red) and HandGraphCNN 3D (green)), the parkinsonian patient reduced the amplitude ΔAsweep/ΔAfit of its movement during the protocol, and also reduced its speed ΔSsweep. The period ΔTsweep/ΔTfit stayed constant during the experiment. This agrees with the slightly positive MDS-UPDRS III scores (2/2/1/2/1) given by the neurologists.
For the hand movements (Fig. 3 and Supplementary Movie 2), we computed the mean distance between the finger tips and the wrist. We observed a periodic trajectory, with an increase of the period ΔTsweep/ΔTfit, and consequently a reduction of the speed ΔSsweep. Since period is more difficult to assess than amplitude, it might explain why the raters gave so different scores (1/1/0/0/2).
For the pronation-supination movements of the hands (Fig. 4 and Supplementary Movie 3), an angle was computed from the 3D representation. The trajectories were periodic enough to enable detection of the sweeps. Because of the irregularity of the trajectory, it is more accurate to use measures from fits to a periodic function. There was a drop of the amplitude of the movement ΔAfit, consistent with the MDS-UPDRS III scores (1/1/2/2/1).
Overall, these three examples highlight the potential of the current analysis to accurately quantify hand movements over time during MDS-UPDRS III protocols.
Impact of the measured parameters on MDS-UPDRS using statistical analysis
We trained three algorithms (linear regression, decision tree with max_depth = 2, decision tree with max_depth = 3) to predict the averaged MDS-UPDRS III score from the previously defined 7 variables for each video. The results are presented in Table 1 with the coefficients of determination obtained for algorithms trained with correct MDS-UPDRS scores, the averaged coefficients of determination over 100 different randomly shuffled datasets and the pshuffle value used for significance (see Methods for its definition). For the finger tapping and hand movements protocols, all 3 algorithms predicted significantly better the correct MDS-UPDRS III score than algorithms trained with shuffled scores (Table 1). For the prono-supination movements of the hands protocol, algorithms failed to predict the correct scores since algorithms trained with the correct scores performed as well as the ones trained with shuffled scores (pshuffle> 0.1). Using more complex algorithms (Linear regression < Decision tree with max_depth = 2 < Decision tree with max_depth = 3) led to higher coefficient of determinations for each protocol, but to decreases in significance (Table 1).
Table 1
Regression algorithms trained to match MDS-UPDRS scores based on the parameters detected by the automated analysis
| Finger tapping (DeepLabCut 2D) | Hand movements (DeepLabCut 2D) | Pronation-supination (HandGraphCNN 3D) | |
| Linear regression | 0.309 (shuffled: 0.115) | 0.427 (shuffled: 0.087) | 0.286 (shuffled: 0.194) |
| pshuffle= 4.23e-04*** | pshuffle= 4.83e-11*** | pshuffle= 1.27e-01 n.s | |
| Decision tree with max_depth = 2 | 0.461 (shuffled: 0.265) | 0.598 (shuffled: 0.252) | 0.377 (shuffled: 0.405) |
| pshuffle= 6.65e-04** | pshuffle= 2.72e-09*** | pshuffle= 6.20e-01 n.s | |
| Decision tree with max_depth = 3 | 0.609 (shuffled: 0.403) | 0.701 (shuffled: 0.403) pshuffle= 3.95e-04*** | 0.630 (shuffled: 0.602) |
| pshuffle= 1.76e-02 * | pshuffle= 4.05e-01 n.s |
Coefficients of determination are presented for training with the correct scores, the averaged over 100 trainings with shuffled scores, and the probability pshuffle used to test significance (see Materials and Methods).
In conclusion, the different parameters computed using our automated analysis include pertinent information for 3.4 and 3.5 MDS-UPDRS scoring.
Individual correlations with MDS-UPDRS III
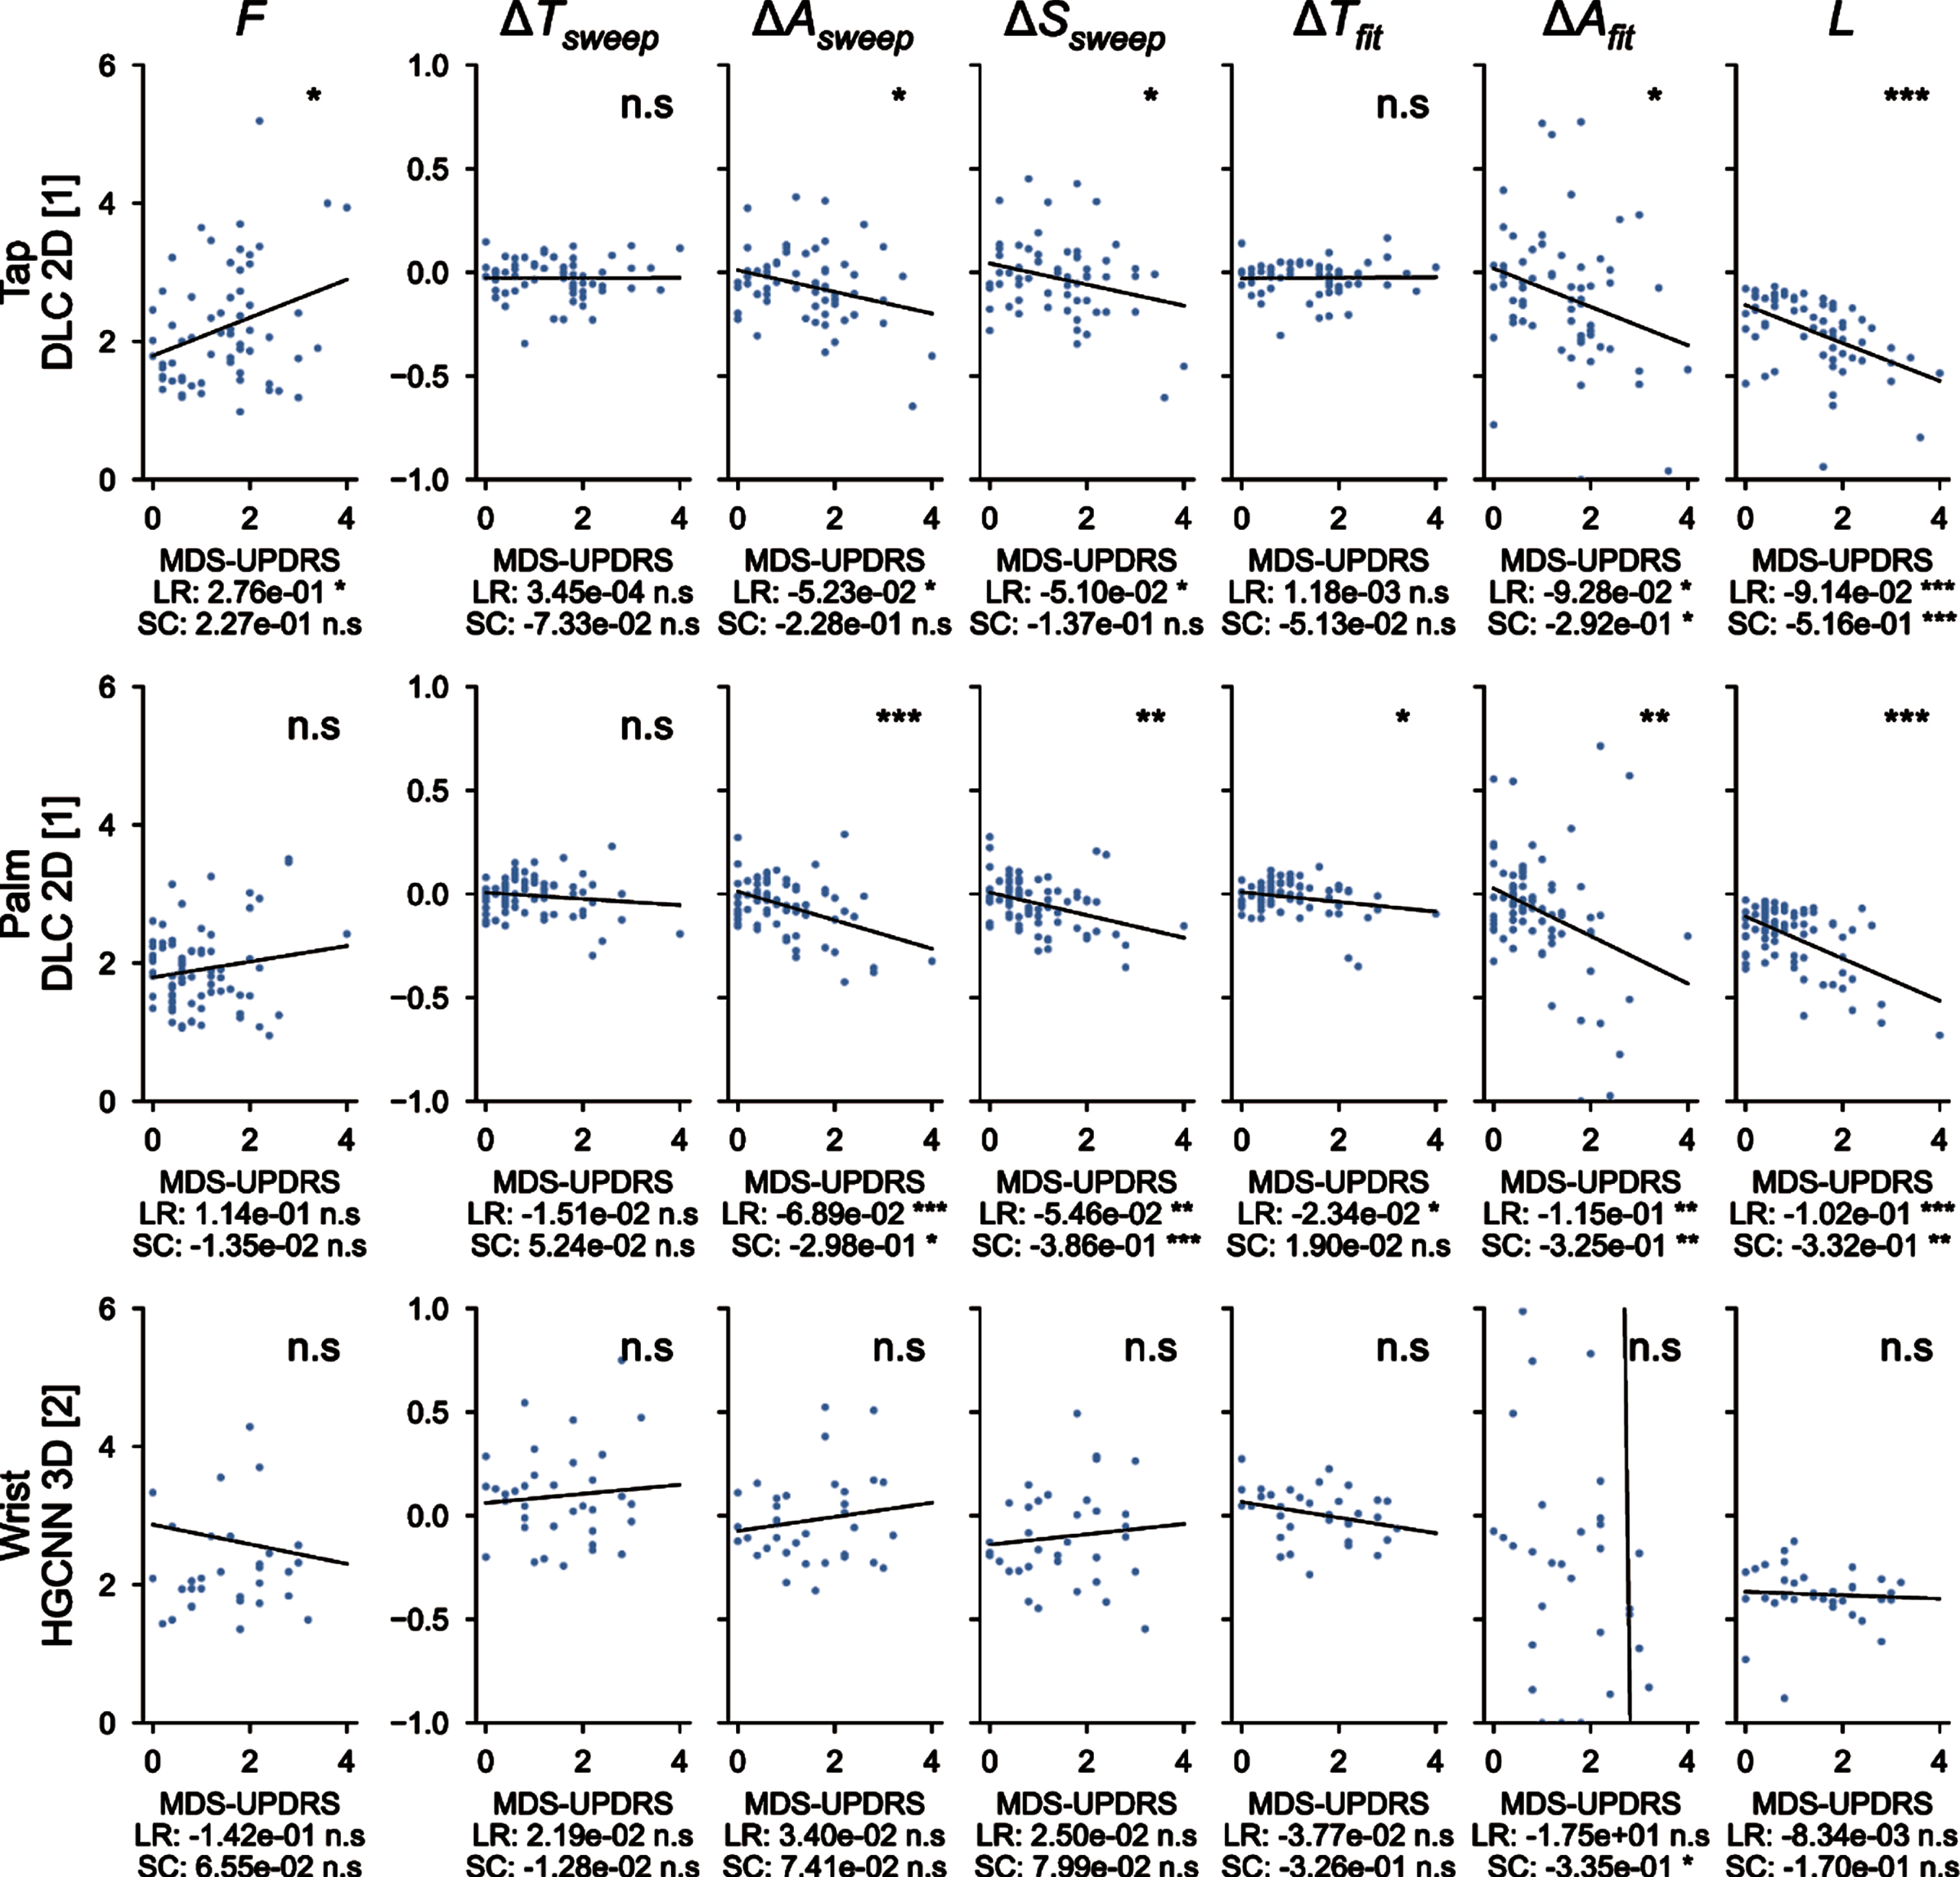
Figure 5 showed correlations of the measured parameters with the averaged MDS-UPDRS III scores. For the finger tapping protocol (top), metrics extracted from the 2D DeepLabCut coordinates are shown here and their correlation with MDS-UPDRS III scores is presented. The variation of amplitude (for both empirical measure and fit), speed and fatigue are significantly correlated with the MDS-UPDRS III scores, with a negative slope, as expected from MDS-UPDRS III guidelines. The other metrics (frequency and period variations) are not significantly correlated. Similar results are observed for the hand movements protocol (center), with higher significant correlations for amplitude (both types of measure), speed and fatigue. Moreover, the period variation measured with the fit is also negatively and significantly correlated. This analysis did not reach significance for pronation-supination movements of the hands (bottom). Overall, measured parameters related to MDS-UPDRS guidelines are directly correlated with MDS-UPDRS scores.
Fig. 5
Correlations between the 7 metrics computed with deep learning algorithms and averaged MDS-UPDRS scores. F, frequency of the repetitions; ΔTsweep, comparison of the duration of the three first/last sweeps; ΔAsweep, comparison of the amplitude of the three first/last sweeps; ΔSsweep, comparison of the speed of the three first/last sweeps; ΔTfit, period variation, which represents the change in period computed from the fit parameters; ΔAfit, amplitude variation, which represents the change in amplitude computed from the fit parameters; L, fatigue parameter which represents the maximal change in amplitude during the whole protocol. ns: not significant; *<0.05, **<0.005, ***<0.0005 for the significance of the p-values. LR, linear regression; SC, Spearman correlation.
DISCUSSION
In this study, we created an innovative tool able to reproduce clinical observations obtained with MDS-UPDRS scores with a precise and objective quantification and an adequate evaluation of the MDS-UPDRS III scores for finger tapping and hand movements. We obtained an accurate extraction of important temporal parameters of MDS-UPDRS III hand tasks, in an automated way only starting from standard videos.
The 7 parameters tested here, exploring speed, frequency, amplitude, duration and fatigue were measured using the automated analysis for finger tapping and hand movements protocols, estimated the MDS-UPDRS III used worldwide for PD motor symptoms evaluation with high coefficients of determination. More importantly, predictions using different statistical learning regression algorithms were significantly higher than algorithms trained with shuffled datasets. We concluded that the 7 parameters computed in the analysis presented here contained enough information for MDS-UPDRS estimation for finger tapping and hand movement protocols. Hand movements probably gave better correlations because we computed the averaged distance for all fingers, compared to the finger tapping metric which only relied on two points, and therefore was more prone to undesired variations. For pronation-supination movements of the hands, our methods did not lead to statistically significant predictions. The non-significant correlation of pronation-supination with MDS-UPRDS III might be due to the vertical plane of video recording and a horizontal one would be more appropriate and should be considered for further studies. This might also be explained by the low number of samples to reach a significant response. Indeed, less than half of the videos with pronation-supination movements of the hands passed all the tests to be included in the prediction analysis. Moreover, we computed individual correlations for the three protocols, and showed that the variation of amplitudes, speed and fatigue were significantly correlated with the MDS-UPRDS III scores. Importantly, the parameters measured in this analysis were consistent with MDS-UPRDS III guidelines for scoring. For instance, despite some studies analyzed more than 10 repetitions [20–22], we limited the repetitions to 10 because we wanted to strictly follow the MDS-UPDRS III recommendations. The 2D and 3D models of the hand recorded by video allow precise quantification of multiple parameters such as speed, amplitude and rate of the movement during MDS-UPDRS III evaluation. Thus, the composite parameters analyzed here are the same as those used for assessing bradykinesia during a medical consultation. Bradykinesia is a complex phenomenon of slowness of movement that cannot be seen only as a simple decrease of the movement rate [12], and therefore more complex properties need to be considered in the scoring. The video-based method described in our study by-passes the subjective measurements of these parameters.
As already stated in the literature [7–12], we also highlight here that MDS-UPDRS III scoring is physician-dependent, and as such is a less reliable parameter than an automated and quantifiable assessment tool to evaluate bradykinesia. Here, we video-taped patients in real-life situations without specific preparation and environment. Moreover, patients were not selected regarding the phenotype or the severity of the parkinsonian syndrome, thus providing a representative panel of real-life parkinsonian patients. Importantly, by labelling only 5 frames per videos we demonstrate that, even with scarce labels, the network performs accurately. Overall, the time needed to label 5 frames is quite small (1-2 minutes for an expert) while the operation would last at least an hour to individually label each frame, leading to a great gain in term of time for a result almost as precise as manual labelling.
In the expanding field of telemedicine, the present tool appears of much interest. As an example, COVID-19 pandemic has been striking evidence that remote evaluation of neurological patients is needed, this being even more crucial with chronic diseases [30–32]. It has been shown that remote assessment of MDS-UPDRS III is feasible via videoconferencing, except for specific items such as rigidity, or postural instability, which are not as important as bradykinesia for general evaluation of the disease [33, 34]. Indeed, some studies, which restricted bradykinesia assessment to the upper limb motor tasks of the MDS-UPDRS III, showed that upper limb motor performance was a predictive feature of PD onset and progression [21, 35]. Research on remote evaluation of PD patients has been mainly focused on the use of technological devices [14, 15, 36, 37]. Such techniques require specific setup, which differs from MDS-UPDRS III tasks (e.g., touching tactile screen of tapping, holding the phone during prono-supination). Recording video while clinically assessing the MDS-UPDRS III is easy, and therefore any videos recorded, while strictly following MDS-UPDRS III instructions, can be analyzed and quantified by our system. Also, it is well known that PD patients’ symptoms, such as tremor and motor functions, vary upon emotional load [13, 38]. Thus, by quantifying bradykinesia from homemade videos, in a less stressful environment than hospital or medical consultation, clinicians could have a more reliable assessment of their patient’s condition on a daily life basis. It is noteworthy that this deep-learning analysis of parkinsonian movement could be extended to other body parts (e.g., feet movements, hypomimia, posture) and therefore most of the MDS-UPDRS III procedures [23, 24]. Thus, a wide range of movement disorders, such as tremor or chorea, could be eligible to this strategy of evaluation [16, 39].
This study has several limitations. First, it is a monocentric study, which needs to be extended to other centers. Nevertheless, our PD patient population was similar to epidemiological data found in the medical literature. Two of the 36 patients had atypical parkinsonian syndrome and were still included since we were interested in analyzing parkinsonian movements regardless of the underlying parkinsonian pathology. Indeed, although there are specific scales for the assessment of degenerative parkinsonian syndromes (such as the UMSARS for MSA), clinicians also apply in real life the MDS-UPDRS III to atypical parkinsonian syndromes for the assessment of the parkinsonian symptoms, especially in outpatient clinic/consultation. Secondly, the MDS-UPDRS III is considered as the international and consensual scale which is a reference in the field of parkinsonian symptoms. The main problem with its use can arise from the assessor who rates the MDS-UPDRS III as well as how the guidelines are respected, often resulting in an inter- and intra-rater variability. In our study, to reduce the risk of errors in rating and to maximize the validity of the human rating, we have consciously asked several raters working in a Movement disorders unit to rate the videos. We demonstrated that it is feasible to objectively capture and measure the parameters used in the guidelines to rate the MDS-UPDRS III and then to get rid of inter- and intra-rater variability. Thirdly, regarding pronation-supination movements of the hands, the results were not significant despite a trend for the amplitude parameter. This could be explained by the low number of patients but also the complexity of extracting 3D coordinates. Frontal video recording of the hand pronation-supination movements with the forearm horizontal and not vertical would certainly facilitate the hand rotation analysis. Further prospective analyses with more patients are needed to implement this specific assessment. Forthcoming development of this software will allow analysis of other movement disorders and other body parts.
In conclusion, using a deep-learning approach, we provided a quantitative measurement of bradykinesia that prevents inter-operator variability. We have reached an unprecedented level of precision and simplicity for its assessment. This precision, even at distance, could help non-movement disorder specialists to rate bradykinesia of their patients accurately. It would also be useful for specialists and non-specialists, to monitor bradykinesia of patients at distance, with video recordings provided directly by the patient or caregivers, with appropriate instructions as indicated in the MDS-UPDRS III.
ACKNOWLEDGMENTS
We would thank all the patients for accepting to be filmed.
CONFLICT OF INTEREST
GV, CD, QS, MM, BG, LV declare no conflicts of interest. BD received research support from Orkyn, Merz-Pharma and Contrat de Recherche Clinique 2021 (CRC 2021). No sponsorship was obtained for this study.
SUPPLEMENTARY MATERIAL
[1] The supplementary material is available in the electronic version of this article: https://dx.doi.org/10.3233/JPD-223445.
REFERENCES
[1] | Postuma RB , Berg D , Stern M , Poewe W , Olanow CW , Oertel W , Obeso J , Marek K , Litvan I , Lang AE , Halliday G , Goetz CG , Gasser T , Dubois B , Chan P , Bloem BR , Adler CH , Deuschl G ((2015) ) MDS clinical diagnostic criteria for Parkinson’s disease. Mov Disord 30: , 1591–1601. |
[2] | Berg D , Adler CH , Bloem BR , Chan P , Gasser T , Goetz CG , Halliday G , Lang AE , Lewis S , Li Y , Liepelt-Scarfone I , Litvan I , Marek K , Maetzler C , Mi T , Obeso J , Oertel W , Olanow CW , Poewe W , Rios-Romenets S , Schäffer E , Seppi K , Heim B , Slow E , Stern M , Bledsoe IO , Deuschl G , Postuma RB ((2018) ) Movement disorder society criteria for clinically established early Parkinson’s disease. Mov Disord 33: , 1643–1646. |
[3] | Schilder JCM , Overmars SS , Marinus J , van Hilten JJ , Koehler PJ ((2017) ) The terminology of akinesia, bradykinesia and hypokinesia: Past, present and future. Parkinsonism Relat Disord 37: , 27–35. |
[4] | Bologna M , Paparella G , Fasano A , Hallett M , Berardelli A ((2020) ) Evolving concepts on bradykinesia. Brain 143: , 727–750. |
[5] | Goetz CG , Tilley BC , Shaftman SR , Stebbins GT , Fahn S , Martinez-Martin P , Poewe W , Sampaio C , Stern MB , Dodel R , Dubois B , Holloway R , Jankovic J , Kulisevsky J , Lang AE , Lees A , Leurgans S , LeWitt PA , Nyenhuis D , Olanow CW , Rascol O , Schrag A , Teresi JA , van Hilten JJ , LaPelle N , Movement Disorder Society UPDRS Revision Task Force ((2008) ) Movement Disorder Society-sponsored revision of the Unified Parkinson’s Disease Rating Scale (MDS-UPDRS): Scale presentation and clinimetric testing results. Mov Disord 23: , 2129–2170. |
[6] | Goetz CG , Fahn S , Martinez-Martin P , Poewe W , Sampaio C , Stebbins GT , Stern MB , Tilley BC , Dodel R , Dubois B , Holloway R , Jankovic J , Kulisevsky J , Lang AE , Lees A , Leurgans S , LeWitt PA , Nyenhuis D , Olanow CW , Rascol O , Schrag A , Teresi JA , Van Hilten JJ , LaPelle N ((2007) ) Movement Disorder Society-sponsored revision of the Unified Parkinson’s Disease Rating Scale (MDS-UPDRS): Process, format, and clinimetric testing plan. Mov Disord 22: , 41–47. |
[7] | Goetz CG , Stebbins GT ((2004) ) Assuring interrater reliability for the UPDRS motor section: Utility of the UPDRS teaching tape. Mov Disord 19: , 1453–1456. |
[8] | Post B , Merkus MP , de Bie RMA , de Haan RJ , Speelman JD ((2005) ) Unified Parkinson’s disease rating scale motor examination: Are ratings of nurses, residents in neurology, and movement disorders specialists interchangeable? . Mov Disord 20: , 1577–1584. |
[9] | Turner TH , Dale ML ((2020) ) Inconsistent movement disorders society-unified Parkinson’s disease rating scale part III ratings in the Parkinson’s progression marker initiative. Mov Disord 35: , 1488–1489. |
[10] | Lu M , Zhao Q , Poston KL , Sullivan EV , Pfefferbaum A , Shahid M , Katz M , Kouhsari LM , Schulman K , Milstein A , Niebles JC , Henderson VW , Fei-Fei L , Pohl KM , Adeli E ((2021) ) Quantifying Parkinson’s disease motor severity under uncertainty using MDS-UPDRS videos. Med Image Anal 73: , 102179. |
[11] | Evers LJW , Krijthe JH , Meinders MJ , Bloem BR , Heskes TM ((2019) ) Measuring Parkinson’s disease over time: The real-world within-subject reliability of the MDS-UPDRS. Mov Disord 34: , 1480–1487. |
[12] | Park KW , Lee E-J , Lee JS , Jeong J , Choi N , Jo S , Jung M , Do JY , Kang D-W , Lee J-G , Chung SJ ((2021) ) Machine learning-based automatic rating for cardinal symptoms of Parkinson disease. Neurology 96: , e1761–e1769. |
[13] | Blakemore RL , MacAskill’ MR , Shoorangiz R , Anderson TJ ((2018) ) Stress-evoking emotional stimuli exaggerate deficits in motor function in Parkinson’s disease. Neuropsychologia 112: , 66–76. |
[14] | Hasan H , Athauda DS , Foltynie T , Noyce AJ ((2017) ) Technologies assessing limb bradykinesia in Parkinson’s disease. J Parkinsons Dis 7: , 65–77. |
[15] | Merola A , Sturchio A , Hacker S , Serna S , Vizcarra JA , Marsili L , Fasano A , Espay AJ ((2018) ) Technology-based assessment of motor and nonmotor phenomena in Parkinson disease. Expert Rev Neurother 18: , 825–845. |
[16] | Lu R , Xu Y , Li X , Fan Y , Zeng W , Tan Y , Ren K , Chen W , Cao X ((2020) ) Evaluation of wearable sensor devices in Parkinson’s disease: A review of current status and future prospects. Parkinsons Disease 2020: , 4693019. |
[17] | Summa S , Tosi J , Taffoni F , Di Biase L , Marano M , Rizzo AC , Tombini M , Di Pino G , Formica D ((2017) ) Assessing bradykinesia in Parkinson’s disease using gyroscope signals. IEEE Int Conf Rehabil Robot 2017: , 1556–1561. |
[18] | Ancona S , Faraci FD , Khatab E , Fiorillo L , Gnarra O , Nef T , Bassetti CLA , Bargiotas P ((2022) ) Wearables in the home-based assessment of abnormal movements in Parkinson’s disease: A systematic review of the literature. J Neurol 269: , 100–110. |
[19] | Heremans E , Nackaerts E , Broeder S , Vervoort G , Swinnen SP , Nieuwboer A ((2016) ) Handwriting impairments in people with Parkinson’s disease and freezing of gait. Neurorehabil Neural Repair 30: , 911–919. |
[20] | Akram N , Li H , Ben-Joseph A , Budu C , Gallagher DA , Bestwick JP , Schrag A , Noyce AJ , Simonet C ((2022) ) Developing and assessing a new web-based tapping test for measuring distal movement in Parkinson’s disease: A Distal Finger Tapping test. Sci Rep 12: , 386. |
[21] | Monje MHG , Domínguez S , Vera-Olmos J , Antonini A , Mestre TA , Malpica N , Sánchez-Ferro Á ((2021) ) Remote evaluation of Parkinson’s disease using a conventional webcam and artificial intelligence. Front Neurol 12: , 742654. |
[22] | Yin Z , Geraedts VJ , Wang Z , Contarino MF , Dibeklioglu H , van Gemert J ((2022) ) Assessment of Parkinson’s disease severity from videos using deep architectures. IEEE J Biomed Health Inform 26: , 1164–1176. |
[23] | Shin JH , Yu R , Ong JN , Lee CY , Jeon SH , Park H , Kim H-J , Lee J , Jeon B ((2021) ) Quantitative gait analysis using a pose-estimation algorithm with a single 2D-video of Parkinson’s disease patients. J Parkinsons Dis 11: , 1271–1283. |
[24] | Lu M , Poston K , Pfefferbaum A , Sullivan EV , Fei-Fei L , Pohl KM , Niebles JC , Adeli E ((2020) ) Vision-based estimation of MDS-UPDRS gait scores for assessing Parkinson’s disease motor severity. Med Image Comput Comput Assist Interv 12263: , 637–647. |
[25] | Guo Z , Zeng W , Yu T , Xu Y , Xiao Y , Cao X , Cao Z (2022) Vision-based Finger Tapping Test in patients with Parkinson’s disease via spatial-temporal 3D hand pose estimation. IEEE J Biomed Health Inform. doi: 10.1109/JBHI.2022.3162386. |
[26] | Mathis A , Mamidanna P , Cury KM , Abe T , Murthy VN , Mathis MW , Bethge M ((2018) ) DeepLabCut: Markerless pose estimation of user-defined body parts with deep learning. Nat Neurosci 21: , 1281–1289. |
[27] | Gilman S , Wenning GK , Low PA , Brooks DJ , Mathias CJ , Trojanowski JQ , Wood NW , Colosimo C , Dürr A , Fowler CJ , Kaufmann H , Klockgether T , Lees A , Poewe W , Quinn N , Revesz T , Robertson D , Sandroni P , Seppi K , Vidailhet M ((2008) ) Second consensus statement on the diagnosis of multiple system atrophy. Neurology 71: , 670–676. |
[28] | Doosti B (2019) Hand Pose estimation: A survey. arXiv:190301013 [cs]. |
[29] | Ge L , Ren Z , Li Y , Xue Z , Wang Y , Cai J , Yuan J (2019) 3D hand shape and pose estimation from a single RGB image. arXiv, https://doi.org/10.48550/arXiv.1903.00812. |
[30] | McKenna MC , Al-Hinai M , Bradley D , Doran E , Hunt I , Hutchinson S , Langan Y , O’Rourke D , Qasem R , Redmond J , Troy E , Doherty CP ((2020) ) Patients’ experiences of remote neurology consultations during the COVID-19 pandemic. Eur Neurol 83: , 622–625. |
[31] | Patterson A , Clark MA ((2020) ) COVID-19 and power in global health. Int J Health Policy Manag 9: , 429–431. |
[32] | Lim S-Y , Tan AH , Fox SH , Evans AH , Low SC ((2017) ) Integrating patient concerns into Parkinson’s disease management. Curr Neurol Neurosci Rep 17: , 3. |
[33] | Abdolahi A , Scoglio N , Killoran A , Dorsey ER , Biglan KM ((2013) ) Potential reliability and validity of a modified version of the Unified Parkinson’s Disease Rating Scale that could be administered remotely. Parkinsonism Relat Disord 19: , 218–221. |
[34] | Stillerova T , Liddle J , Gustafsson L , Lamont R , Silburn P ((2016) ) Remotely assessing symptoms of Parkinson’s disease using videoconferencing: A feasibility study. Neurol Res Int 2016: , 4802570;. |
[35] | Poewe WH , Wenning GK ((1998) ) The natural history of Parkinson’s disease: Natural history of PD. Ann Neurol 44: , S1–S9. |
[36] | Kassavetis P , Saifee TA , Roussos G , Drougkas L , Kojovic M , Rothwell JC , Edwards MJ , Bhatia KP ((2016) ) Developing a tool for remote digital assessment of Parkinson’s disease. Mov Disord Clin Pract 3: , 59–64. |
[37] | Kostikis N , Hristu-Varsakelis D , Arnaoutoglou M , Kotsavasiloglou C , Baloyiannis S ((2011) ) Towards remote evaluation of movement disorders via smartphones. Annu Int Conf IEEE Eng Med Biol Soc 2011: , 5240–5243. |
[38] | Raethjen J , Austermann K , Witt K , Zeuner KE , Papengut F , Deuschl G ((2008) ) Provocation of Parkinsonian tremor. Mov Disord 23: , 1019–1023. |
[39] | Tortelli R , Rodrigues FB , Wild EJ ((2021) ) The use of wearable/portable digital sensors in Huntington’s disease: A systematic review. Parkinsonism Relat Disord 83: , 93–104. |

