
Longer Duration of Hypertension and MRI Microvascular Brain Alterations Are Associated with Lower Hippocampal Volumes in Older Individuals with Hypertension
Abstract
Background:
Hippocampal atrophy is associated with cognitive decline. Determining the clinical features associated with hippocampal volume (HV)/atrophy may help in tailoring preventive strategies.
Objective:
This study was aimed to investigate the association between HV (at visit 2) and vascular status (both at visit 1 and visit 2) in a cohort of individuals aged 60+ with hypertension and without overt cognitive impairment at visit 1 (visit 1 and visit 2 were separated by approximately 8 years).
Methods:
Hippocampal volume was estimated in brain MRIs as HV both clinically with the Scheltens’ Medial Temporal Atrophy score, and automatically with the Free Surfer Software application. A detailed medical history, somatometric measurements, cognitive tests, leukoaraiosis severity (Fazekas score), vascular parameters including pulse wave velocity, central blood pressure, and carotid artery plaques, as well as several biochemical parameters were also measured.
Results:
113 hypertensive patients, 47% male, aged 75.1±5.6 years, participated in both visit 1 and visit 2 of the ADELAHYDE study. Age (β= –0.30) and hypertension duration (β= –0.20) at visit 1 were independently associated with smaller HV at visit 2 (p < 0.05 for all). In addition to these variables, low body mass index (β= 0.18), high MRI Fazekas score (β= –0.20), and low Gröber-Buschke total recall (β= 0.27) were associated with smaller HV at visit 2 (p < 0.05 for all).
Conclusion:
In a cohort of older individuals without cognitive impairment at baseline, we described several factors associated with lower HV, of which hypertension duration can potentially be modified.
INTRODUCTION
The hippocampus is a brain area with a crucial role in several memory functions. Hippocampal atrophy is one of the most typical anatomical and imaging findings of Alzheimer’s disease (AD) [1]. Several reports, including a meta-analysis of 28 studies (789 patients), showed that hippocampal volume (HV) is associated with cognitive impairment [2]. Recently-developed automatic software has enabled the accurate, quick, and reliable assessment of HV from magnetic resonance imaging (MRI) [3, 4].
Identifying the risk factors associated with cognitive decline is relevant to design better prevention strategies; as HV is associated with cognitive impairment, identifying the factors associated with smaller HV may serve as an early surrogate for cognitive alterations. Increasing evidence suggests that long standing hypertension, diabetes, hypercholesterolemia, and overt vascular damage contribute to memory impairment and the pathogenesis of vascular dementia and AD. Although the exact underlying mechanisms remain unclear, vascular lesions may activate pathways leading to neurodegenerative lesions [5].
The aim of the present study was to investigate the association between vascular status and HV (between two visits separated by approximately 8 years), in older hypertensive subjects without overt cognitive impairment. HV was measured both clinically by Scheltens’ Medial lobe Temporal Atrophy (MTA) score, and automatically with the use of the Free Surfer Software (FSS).
METHODS
Study population
The ADELAHYDE study was a prospective, longitudinal, single-center study, with two visits (visit 1, V1 and visit 2, V2) separated by approximately 8 years, investigating the role of vascular factors in the evolution of cognitive impairment and dementia in a cohort of elderly hypertensive patients. Inclusion criteria for ADELAHYDE were age 60–85 years with arterial hypertension (>1 year from diagnosis, receiving antihypertensive treatment for at least one month), presenting with low-grade subjective memory complaints (SMCs) defined as a McNair scale >15 (revised validated French version of 26 items). Patients were initially (V1) recruited in 2005 by local press advertisements or referral by general practitioners from an investigator network of the Inserm Clinical Investigation Centre. Patients initially included at V1 were contacted by telephone to participate in the second visit (V2) (conducted from April 2011 to November 2013). Of the 376 patients included in V1, 131 participated in V2 (among the rest, 51 patients died, 60 were lost to follow-up, 130 were not able to visit due to their functional status and/or refused to participate, and 6 patients provided no specific reason). This follow up participation rate, about 35%, is noticed also in other longitudinal epidemiological studies in elderly people, not only because of the high rate of mortality in these ages but mostly because of the important and accelerated functional and cognitive status impairment above the age of 65 [6, 7]. Finally, 113 of the 131 participants underwent an MRI examination and were included in the analysis. Further information on the study description is provided in previous publications [8] and at ClinicalTrials.gov (NCT01351961).
Vascular measurements and target organ damage assessment
Blood pressure was measured on the left arm, in the supine position, after a minimum 10-min rest, using a validated electronic device (DINAMAP 400Pro). Arterial stiffness was estimated by the gold standard methodology, pulse wave velocity (PWV), measured automatically by mechano-transducers, with the Complior device (Colson, Paris, France). Additionally, Augmentation Index was estimated by applanation tonometry in the radial artery (SphygmoCor Pulse Wave Analysis; PWV Medical Pty Ltd, Ermington, Sydney, Australia). Left ventricular hypertrophy (LVH) was defined by the presence of Sokolow-Lyon (>38 mm) and/or Cornell product (>2.44 mm*ms) indices on electrocardiogram (ECG). Intima media thickness, as well as atheromatous plaques, were estimated in the common carotid arteries with ultrasonography (B mode system with a 7.5-MHz linear array transducer (ATL Apogee 800). Microalbuminuria was determined in 24-h urine collection samples [9].
Cognitive status assessment
Cognitive status was assessed based on performance in various psychometric tests. More specifically, McNair’s Cognitive Difficulties Scale, the Geriatric Depression Scale, and the Free and Cued Selective Reminding Test (FCSRT) for immediate and delayed memory and language (free and cued recall) were performed by trained psychologists in both visits. Composite scores (Global memory test) were calculated for memory function (real memory score, including two components from the FCSRT: free [episodic memory] and cued [semantic memory] recalls), verbal fluency (which describes language lexical fluidity and includes four tests), and visual memory capacity (visual memory score, defining raw visual memory and errors with two tests). Each composite score was computed by transforming individual test scores into standardized z-scores (z-score ¼ test score-mean test score/ standard deviation [SD]). A higher value in the Global Memory Test reflected worse memory function.
Brain MRI imaging analysis
Brain imaging analysis was performed using brain MRI obtained with a 1.5 Tesla system (Signal General Electric; GEMS), performed in the axial and sagittal planes with a slice thickness of 5-mm. HV was estimated by two different methodologies, manually by an expert radiologist based on the MTA scale, known as Scheltens’ score, and automatically with FSS [10]. Grading of the Scheltens’ score includes a 5-stage escalation (0: no atrophy, 1: only widening of choroid fissure, 2: also widening of the temporal horn of lateral ventricle, 3: moderate loss of HV (decrease in height), and 4: severe loss of HV) [11]. Free Surfer software version 5.2 (http://surfer.nmr.mgh.harvard.edu/) was applied on high-resolution 3D-T1-weighted MR images to obtain HV for all subjects using an observer-independent approach. Hippocampal segmentations were based on a statistical atlas built primarily on ultra-high resolution (∼0.1 mm isotropic) ex-vivo MRI data. All HV (measured in mm3) were standardized for total intracranial volume (TIV, measured in mm3) by dividing on TIV in order to overcome the potential differences due to variations of cranial cavity size and height [3, 12]. In order to avoid excessive decimal places in the HV/TIV ratio, and to facilitate the readability of the manuscript, we multiplied this ratio by 1000. Notwithstanding, we also performed the analysis by adjusting HV on TIV within the models.
A white matter hypertrophy (WMH) grading was conducted using the T2-weighted axial images. The grading was performed as described in detail elsewhere [8], using the scale of Fazekas, accounting separately for periventricular lesions and deep white matter lesions (subcortical). According to the number of deep white matter and periventricular lesions, patients were divided into 3 groups (0-1, 2-3, and 4–6) [4, 13]. Both manual MRI evaluations (Fazekas scale and Scheltens’ score) were performed by an experienced neuroradiologist blinded to the patients’ clinical characteristics.
Genetic associations
Genotyping was performed in the context of a multimarker assay using an immobilized probe approach, as described previously [14] (Roche Molecular Systems, Alameda, CA, USA). In total, 10 AD-related genes/polymorphisms were extracted and included in the present analysis.
These genetic variables are expressed as categorical because alleles exist in each gene. For example, ApoE 112 has cysteine and arginine as allele. So, the combination of alleles in this gene are cysteine-cysteine, cysteine-arginine, and arginine-arginine.
Statistical analysis
For continuous variables, results are presented as mean±standard deviation, while non-parametric tests results are presented as median (percentile25–75); categorical variables are presented as numbers (n) and proportions (%). HV was divided by the median value in below versus above the median to obtain similar proportion of patients within each subgroup. Student t-test or Mann–Whitney test was used to estimate differences in mean values between two groups (above versus below the median) if the distribution of the variables was normal or skewed, respectively. One-way ANOVA with Tukey post-hoc test for the correction for multiple comparisons when the groups were three or more. Analysis of qualitative variables was carried out by the Chi-square test. To explore the relationship between HV and Scheltens’ score with target organ damage and cardiovascular risk factors while controlling for other covariates, both linear multivariate analyses, with the enter method, and logistic multivariate analysis models were applied, respectively. All variables with p < 0.15 in univariate analysis were included in the multivariate models. A p value < 0.05 was considered statistically significant. All analyses were performed with STATA version 16.
The data will be available to other researchers upon request with a detailed hypothesis and Statistical Analysis Plan (SAP) addressed to Pr. Athanase Benetos ([email protected]).
RESULTS
Characteristics of study patients
In total, 113 subjects, 46% male, aged 75.1±5.6 years, had MRI brain images and were included in the present analysis. Baseline characteristics of the study population are summarized in Table 1. According to Scheltens Score classification, 53% (n = 60) of participants had no atrophy (stage 0), 31% (n = 35) had only widening of choroid fissure (stage 1), and 16% (n = 18) had widening of the temporal horn of the lateral ventricle or greater (stage 2). Male patients had significantly smaller HV/TIV(*1000) assessed by FSS than females (2.54 versus 2.71, p = 0.017).
Table 1
Characteristics of the study population undergoing visit 2 of the ADELAHYDE study, according to median hippocampal volume measured with the Free Surfer Software (adjusted for total intracranial volume)
| Population characteristics | Total n = 113 | volumea (median) | p-value | |
| <2.7 (n = 57) | ≥2.7 (n = 56) | |||
| Socio-demographic parameters | ||||
| Female gender, n (%) | 61 (54.0) | 27 (47.4) | 34 (60.7) | 0.15 |
| Age (years) | 75.1±5.6 | 76.5±5.5 | 73.7±5.3 | 0.005 |
| Intermediate/high education level, n (%) | 81 (71.7) | 39 (68.4) | 42 (75.0) | 0.44 |
| Risk and hemodynamic factors | ||||
| Past/current smoker, n (%) | 44 (38.9) | 23 (40.4) | 21 (37.5) | 0.76 |
| BMI (kg/m2) | 27.8±4.8 | 27.4±4.3 | 29.9±4.9 | 0.007 |
| SBP (mmHg) | 140.9±17.7 | 140±16 | 142±19 | 0.55 |
| DBP (mmHg) | 72.9±9.5 | 72±9 | 74±9 | 0.40 |
| Pulse pressure (mmHg) | 68.0±13.4 | 68±12 | 68±14 | 0.83 |
| Heart rate (bpm) | 62.1±9.5 | 63±9 | 65±10 | 0.24 |
| (Laboratory work-up, Biochemical examinations) | ||||
| MDRD eGFR (ml/min/1.73m2) | 70.3±15.7 | 69±16 | 71±15 | 0.47 |
| Sodium (mmol/L) | 140.1±2.1 | 139.8±2.5 | 140.3±1.7 | 0.23 |
| Total cholesterol (g/L) | 2.02±0.4 | 2.05±0.43 | 1.95±0.41 | 0.28 |
| LDL cholesterol (g/L) | 1.19±0.34 | 1.22±0.35 | 1.16±0.33 | 0.33 |
| HDL cholesterol (g/L) | 0.57±0.15 | 0.59±0.14 | 0.56±0.15 | 0.31 |
| Homocysteine (mmol/L)* | 15.3 (12.5–17.1) | 15.6±4.5 | 15.0±5.1 | 0.53 |
| C-reactive protein (mg/L)* | 2.1 (1–4.9) | 1.6 (0.8–4.8) | 3.1 (1.4–5.3) | 0.11 |
| Medical history | ||||
| Hypertension duration (years)* | 20.8±8.1 | 22.5 (15–27) | 18.0 (13–24) | 0.050 |
| Diabetes, n (%) | 19 (16.8) | 7 (12.3) | 12 (21.4) | 0.19 |
| HbA1c (%) | 6.1±1.04 | 5.9±1.0 | 6.2±1.1 | 0.11 |
| History of vascular events | ||||
| – myocardial infarction | 18 (15.9) | 11 (19.3) | 7(12.5) | 0.32 |
| – stroke | 4 (3.5) | 2 (3.5) | 2 (3.6) | 0.99 |
| – transient ischemic attack | 6 (5.3) | 2 (3.5) | 4 (7.4) | 0.36 |
| Medications | ||||
| ACEi/ARBs, n (%) | 81 (71.7) | 41 (71.9) | 40 (71.4) | 0.95 |
| Beta-blockers, n (%) | 37 (32.7) | 17 (29.8) | 20 (35.7) | 0.51 |
| CCB, n (%) | 41 (36.3) | 21 (36.8) | 20 (35.7) | 0.90 |
| Diuretics, n (%) | 57 (50.4) | 29 (50.9) | 28 (50.0) | 0.93 |
| Statins, n (%) | 64 (56.6) | 32 (56.1) | 32 (57.1) | 0.91 |
| Antithrombotic agents, n (%) | 22 (19.5) | 17 (29.8) | 5 (8.9) | 0.005 |
| Paraclinical investigations and psychometric assessment | ||||
| Gröber-Buschke test: | ||||
| – free recall | 25.6±8.6 | 22.1±9.6 | 28.6±6.8 | <0.001 |
| – total recall (free and cued) | 46 (42–48) | 43 (40–47) | 47 (45.5–48) | <0.001 |
| – composite score (“global memory”) | 1.1±1.3 | 1.4±1.3 | 0.7±1.2 | 0.004 |
| Target organ damage | ||||
| Intima-media thickness (mm) | 0.72±0.23 | 0.73±0.22 | 0.72±0.24 | 0.94 |
| Carotid atheromatous plaque, n (%) | 30 (26.5) | 16 (29.1) | 14 (25.5) | 0.67 |
| Pulse wave velocity (m/s) | 12.3±3.9 | 12.6±4.1 | 12.0±3.7 | 0.45 |
| Augmentation index (%) | 38.2±18.6 | 37.3±14.8 | 39.0±21.7 | 0.64 |
| LV hypertrophy on ECG, n (%) | 16 (14.2) | 7 (12.5) | 9 (16.4) | 0.56 |
| Microalbuminuria (mg/L)* | 9.4 (3.7–19.2) | 9.2 (4.1–17.5) | 9.7 (3.4–25.1) | 0.95 |
| MRI Fazekas Score | ||||
| 0–3 scale in categories, n (%) | 70 (61.9) | 30 (52.6) | 40 (71.4) | 0.040 |
| 4–6 scale in categories, n (%) | 43 (38.1) | 27 (47.4) | 16 (28.6) | |
| MRI Scheltens’ score, n (%) | ||||
| 0 | 59 (52.7) | 19 (33.9) | 40 (71.4) | <0.001 |
| ≥1 | 53 (47.3) | 37 (66.1) | 16 (28.6) | |
For continuous variables, results are presented as mean±standard deviation while *non-parametric tests results are presented as median (percentile25–75); categorical variables are presented as numbers (n) and proportions (%). aValues of hippocampal volume have been calculated by the division of HV in mm3 by the total intracranial volume (mm3) and multiplied by 1000. BMI, body mass index; SBP, systolic blood pressure; DBP, diastolic blood pressure; LV, left ventricular; ECG, electrocardiogram; MDRD, modified of diet in renal disease equation 4; eGFR, estimated glomerular filtration rate; LDL, low-density lipoprotein; HDL, high-density lipoprotein; HbA1c, glycated hemoglobin; ACEi/ARBs, angiotensin converting enzyme inhibitors/angiotensin receptor blockers; CCB, calcium channel blockers; MRI, magnetic resonance imaging.
Visit 1 predictors of hippocampal volume at visit 2
Male sex (β= –0.26), age (β= –0.30), and hypertension duration (β= –0.20) at visit 1 were associated with smaller HV (divided by the TIV) at visit 2 (p < 0.05 for all). The total model was able to explain 22% of the variation in HV (Table 2, Fig. 1). The associations of the HV adjusted on the TIV (instead of divided) remained similar to those above described, except for male sex, that lost statistical significance (Supplementary Table 2).
Table 2
Linear regression multivariate model to determine the factors at visit 1 associated with hippocampal volume at visit 2 assessed with FSS
| Hippocampal volume | B | 95% CI | p |
| Visit 1 | |||
| Overall model fit (Adj. R2 = 0.22) | – | – | <0.001 |
| Constant | 4.5 | 3.7 to 5.3 | <0.001 |
| Gender (male versus female) | –0.20 | –0.33 to –0.07 | 0.002 |
| Age (per each 10 y) | –0.25 | –0.37 to –0.13 | <0.001 |
| Hypertension duration (y) | –0.01 | –0.02 to –0.01 | 0.039 |
FSS, Free Surfer Software; BMI, body mass index; MRI, magnetic resonance imaging. Values of hippocampal volume have been calculated by the division of HV in mm3 by the total intracranial volume (mm3) and multiplied by 1000.
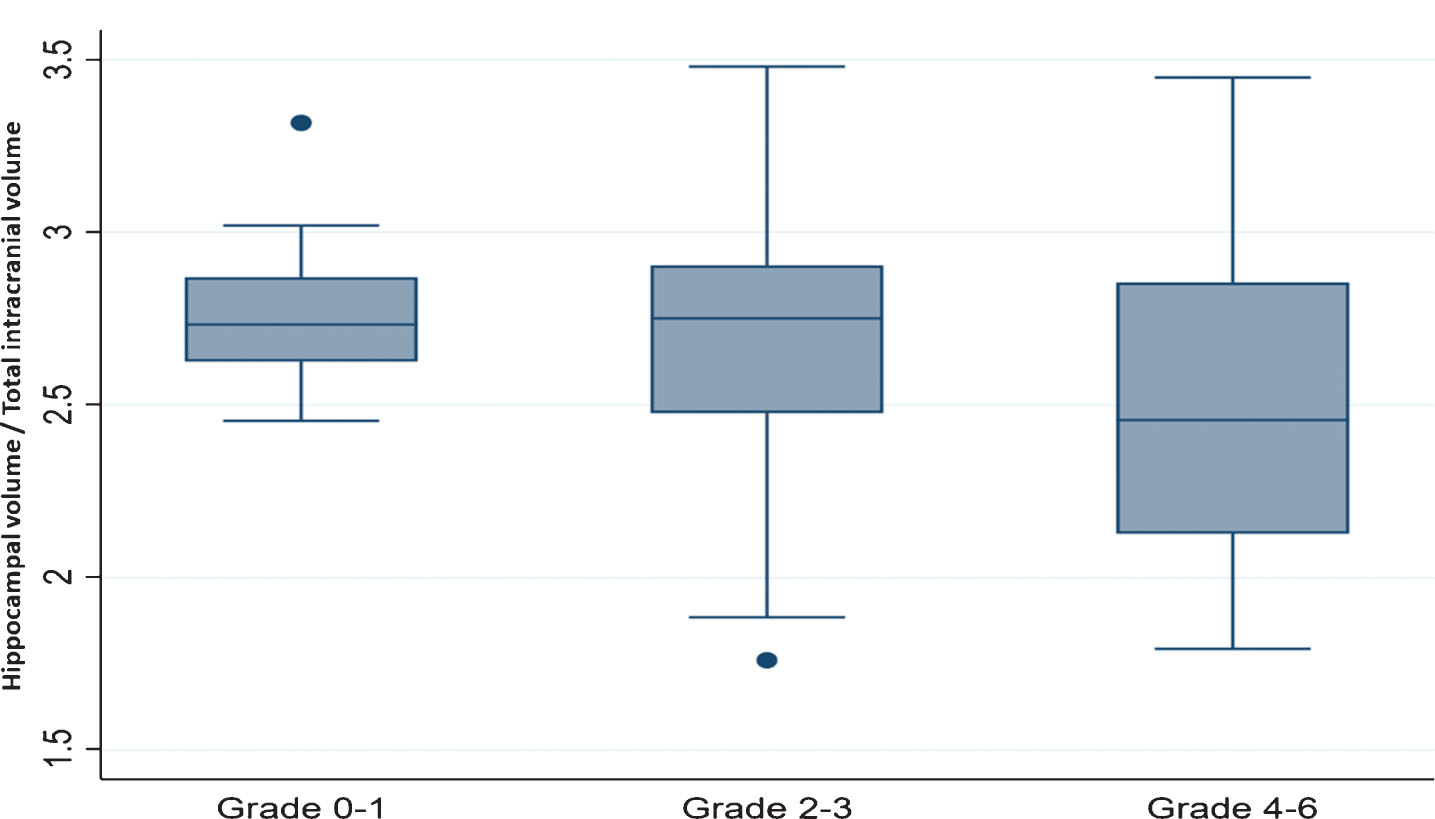
Fig.1
Hippocampal volume assessed with Free Surfer Software according to Fazekas scale (grade, category). y axis, hippocampal volume (average of left plus right hippocampal volume in mm3) divided by the total intracranial volume (in mm3) multiplied by 1000; x axis, Fazekas grade. Multiple-comparison adjusted post-hoc test: Grade 0-1 versus Grade 2-3, p = 0.50; Grade 0-1 versus Grade 4–6, p = 0.031; Grade 2-3 versus Grade 4–6, p = 0.008.
Associations of hippocampal volume at visit 2
Older age (β= –0.24), male sex (β= –0.22), lower body mass index (BMI; β= 0.18), longer history of hypertension (β= –0.20), higher Fazekas score (β= –0.20), and a reduced Cognitive Test Score (β= 0.27), were all associated with smaller HV. The total model was able to explain 39% of the variation in HV (Table 3). Similarly, to the above described, the associations of the HV adjusted on TIV (instead of divided) remained similar to those above described, except for male sex, that lost statistical significance and BMI that showed only a tendency toward lower HV (Supplementary Table 3). Regarding the Scheltens score, in the multivariate logistic regression model, all MRI variables (Fazekas scale and HV estimated by FSS) were associated with it, independently of the other clinical factors. In the model without the MRI variables, increased age and worse memory function also remained statistically significant predictors of an increased Scheltens’ score (Supplementary Table 4).
Table 3
Linear regression multivariate model in determining the factors at visit 2 associated with hippocampal volume also at visit 2
| Hippocampal volume | B | 95% CI | p |
| Visit 2 | |||
| Overall model fit (Adj. R2 = 0.39) | – | – | <0.001 |
| Constant | 3.10 | 2.10 to 4.10 | <0.001 |
| Gender (male versus female) | –0.17 | –0.29 to –0.05 | 0.009 |
| Age (per each 10 y) | –0.16 | –0.27 to –0.05 | 0.004 |
| BMI (Kg/m2) | 0.01 | 0.01 to 0.03 | 0.025 |
| Hypertension duration (y) | –0.01 | –0.02 to –0.01 | 0.014 |
| MRI Fazekas Score | –0.05 | –0.10 to –0.02 | 0.018 |
| Gröber-Buschke: Total Recall (Free &Cued) | 0.02 | 0.01 to 0.03 | 0.002 |
BMI, body mass index; MRI, magnetic resonance imaging. Values of hippocampal volume have been calculated by the division of HV in mm3 by the total intracranial volume (mm3) and multiplied by 1000.
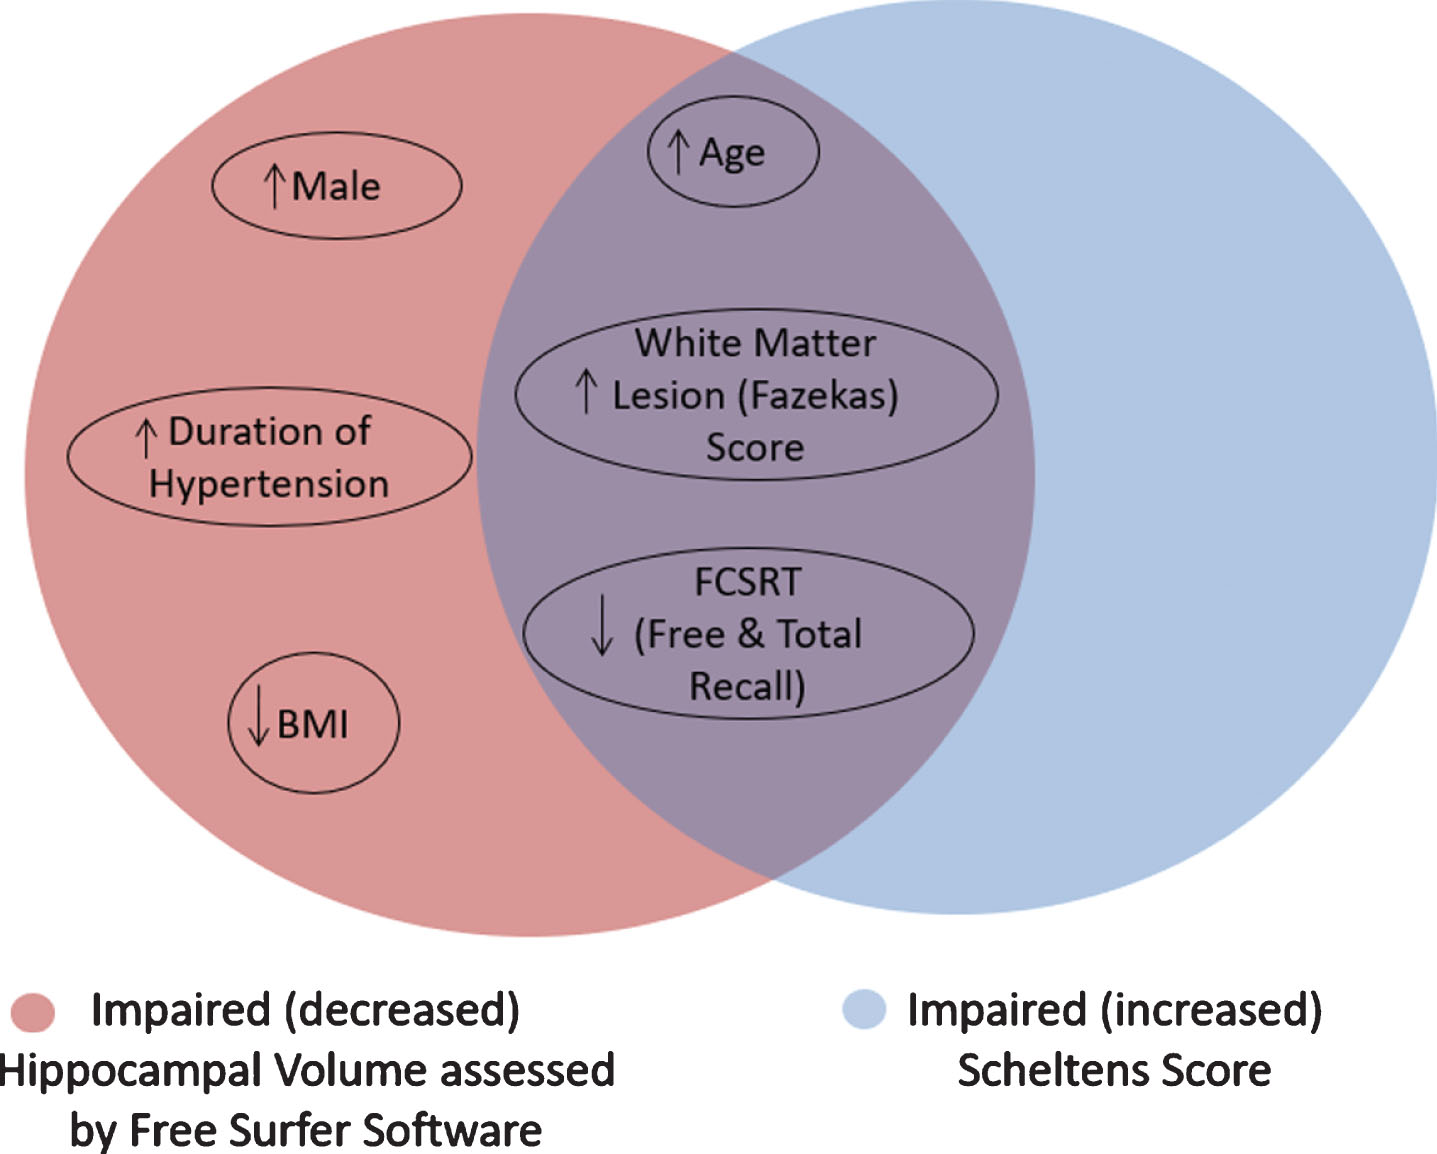
All factors significantly associated with impaired HV are depicted in Fig. 2.
Fig.2
Statistically significant factors correlating with decreased hippocampal volume assessed by Free Surfer Software and Scheltens’ score.
The arterial parameters measured at the baseline assessment of the patients (at V1) were also analyzed, as shown in Supplementary Table 1. Apart from older age, male gender, and long hypertension duration, none of the cognitive status tests performed at V1 were significantly correlated with HV and only the baseline Fazekas risk score showed a tendency to be associated with lower HV (p = 0.069).
No statistically significant difference was found between the change (delta) of cardiovascular risk factors between Visit 1 and 2 and HV (Supplementary Table 5).
Genetic associations with hippocampal volume
In our study, among 113 patients, 81 had cysteine-cysteine, 28 had cysteine-arginine, and 4 had arginine-arginine alleles. None of these alleles was associated with HV (Supplementary Table 6).
DISCUSSION
This study aimed to investigate the association between vascular status and HV, in older hypertensive subjects without overt cognitive impairment. The most important findings of the study were: 1) long duration of hypertension and small vessel disease quantified in MRI with the Fazekas score were independently associated with lower HV; 2) cognitive function scores could predict HV only when performed at the same time with MRIs and not in the past (i.e., 8 years ago), highlighting the importance of the continuing clinical assessment of elderly patients, even if they were in a relatively good cognition in the past.
Our results show that only the duration of hypertension (and not the blood pressure levels) were positively correlated (and “predicted” HV), after considering other risk factors. Studies on the effect of blood pressure levels on cognitive status suggest that midlife BP measurements are much better correlated with cognitive decline than late-life BP measurements. While it is evident that hypertension is one of the most powerful modifiable risk factors for cerebral diseases, most of the studies refer to strokes, with fewer referring to vascular dementia and only a few recent studies have suggested an effect on the progression of AD [15–17]. More specifically, patients with distinctive, pathophysiological alterations of AD (i.e., neurofibrillary tangles and an increased number of neuritic plaques in the entorhinal cortex and hippocampus) as well as total brain atrophy have been found to have elevated blood pressure [18, 19]. This may be due to the fact that blood pressure tends to decrease in the years before dementia diagnosis such that individuals with severe dementia tend to have lower blood pressure than earlier in life and lower blood pressure values than their pairs without dementia [20, 21]. Thus, the duration of hypertension in our population reflects the chronic, cumulative burden of hypertension. Similarly, the microvascular lesions of the white matter quantified in MRI with the Fazekas score also reflect the chronic burden of vascular alterations on the brain. These results are in accordance with data showing that hippocampal atrophy is mainly the result of a chronic rather than acute hypoperfusion [22].
Regarding the other subclinical indices of target organ damage in our study (microalbuminuria, intima-media thickness (IMT), LVH, and arterial stiffness), none of the latter correlated with any of the hippocampal variables. With regards to IMT, data from the Framingham Study showed that neither carotid stenosis nor IMT was associated with HV, suggesting that the association of carotid atherosclerosis with cognitive decline could not be explained by neurodegenerative “AD type” brain changes of the hippocampal area [23]. Experimental models in aged rats with carotid stenosis [24] furthermore showed that only severe carotid artery stenosis, resulted in a significantly lower number of surviving cells in the hippocampal region. Data from the Strong Heart Study on the relationship between LVH and HV previously showed that higher LVM in midlife was associated with a slightly lower general cognitive performance and smaller HV in later life. However, this study had major methodological limitations, since LVH was evaluated only in the first visit and HV only in the second visit (17 years later) [25].
In our study, PWV did not significantly differ between those with a larger versus those with a smaller hippocampus. Nonetheless, it has been documented that patients with increased PWV may have impaired cognitive status later in life [26–29].
In the present study, BMI in visit 2, independently of the other covariates, was positively correlated with HV. However, these results were not confirmed for BMI measured 8 years earlier during visit 1. Most of the studies investigating the relationship between HV and BMI show a consistent negative correlation for both midlife and late-life BMI [30, 31, 31, 32], implying that the noxious effects of obesity may start long before the clinical signs of dementia. A significant correlation only during late life between BMI and HV was also reported in another study investigating the relationship between BMI and while matter lesions, thus supporting that late-life BMI, as in the present our data, is seemingly the most relevant of the two. Moreover, similarly to the reduction in blood pressure, it has been shown that metabolic changes and a reduction in BMI precede the diagnosis of dementia [33, 34]. Similarly, data showing that late life BMI is inversely associated with CSF AD biomarkers and pathological findings in postmortem brains of AD [6, 35] Hence, the relationship between BMI and HV could be due to greater weight loss in those having a smaller hippocampal size.
Our results also suggest that the associations between the arterial factors and HV (and cognitive decline or WMH) are not genetically driven, at least by the genes we investigated.
In our population, cognitive tests performed in Visit 2 (Gröber-Buschke and Global Memory Test) were also associated with HV, independently of the other cardiovascular risk factors, thus confirming previous observations that hippocampal atrophy is associated with cognitive impairment [36, 37]. However, the assessment of cognitive status performed 8 years earlier (during visit 1) was not associated with future HV as measured in visit 2. These results are similar to those of a recently published study showing a limited role of baseline cognitive evaluation in the assessing the progression of MCI to AD over 5 years, in patients which had large HV in the baseline visit [38] further emphasizing the need for particular vigilance by physicians for repeated cognitive status assessment in older hypertensive patients.
Strengths and limitations
Several limitations must be acknowledged in the present study. The most important limitation of our study is the absence of hippocampal and medial temporal atrophy measurements during the first visit, to be able to evaluate the progression of HV, in parallel with the change(s) in vascular and cognitive factors, occurring over time. Moreover, there was a high “attrition”/lost to follow-up in this cohort which limits the power and precision of our findings. The small sample size also precludes from retrieving more information of the data (e.g., regarding subgroups and/or genetic analyses). The FSS was used as a fully automatic tool and manual edits were not implemented. The FSS estimates of the temporal areas (such as entorhinal cortex) have a tendency to overestimate the HV. Moreover, FSS estimates of the temporal areas may be age-biased due to temporal horn widening. Adjusting the HV to the TIV (rather than dividing by it), led to a slight loss of statistical power due to the dispersion of the adjustment variables, however the final models remained stable and only sex lost statistical significance.
Conclusion
In a cohort of older individuals with hypertension and low-grade subjective memory complaints, older age, lower BMI, white matter lesions, cognitive impairment, and hypertension duration were found to be independent determinants of smaller HV. Whether preventive strategies (e.g., blood pressure control) could delay or even reverse potential hippocampal atrophy (and cognitive decline) requires further investigation.
ACKNOWLEDGMENTS
We thank Mr. Pierre Pothier for the editing of the manuscript.
This study was funded by grants from the Programme Hospitalier de Recherche Clinique (PHRC national, N°2010-A01399-30). This work was supported by the “Federation Hospitalo-Universitaire on Cardiac and Arterial Aging – FHU CARTAGE). AB, JPF and PR are partly supported by the French PIA projects: “Lorraine Université d’Excellence” (reference: ANR-15-IDEX-04-LUE) and RHU Fight-HF (reference: ANR-15-RHU-0004). Both public grants are overseen the French National Research Agency (ANR) as part of the second “Investissements d’Avenir” programme.
Authors’ disclosures available online (https://www.j-alz.com/manuscript-disclosures/19-0842r3).
SUPPLEMENTARY MATERIAL
[1] The supplementary material is available in the electronic version of this article: https://dx.doi.org/10.3233/JAD-190842.
REFERENCES
[1] | Wang Z ((2014) ) Characterizing early Alzheimer’s disease and disease progression using hippocampal volume and arterial spin labeling perfusion MRI. J Alzheimers Dis 42 Suppl 4: , S495–S502. |
[2] | Henneman WJ , Sluimer JD , Barnes J , Van Der Flier WM , Sluimer IC , Fox NC ((2009) ) Hippocampal atrophy rates in Alzheimer disease: Added value over whole brain volume measures. Neurology 72: , 999–1007. |
[3] | Wisse LE , Biessels GJ , Geerlings MI ((2014) ) A critical appraisal of the hippocampal subfield segmentation package in Freesurfer. Front Aging Neurosci 6: , 261. |
[4] | Fazekas F , Chawluk JB , Alavi A , Hurtig HI , Zimmerman RA ((1987) ) MR signal abnormalities at 1.5 T in Alzheimer’s dementia and normal aging. AJR Am J Roentgenol 149: , 351–356. |
[5] | Hughes TM , Craft S , Lopez OL ((2015) ) Review of ‘the potential role of arterial stiffness in the pathogenesis of Alzheimer’s disease’. Neurodegener Dis Manag 5: , 121–135. |
[6] | Buchman AS , Schneider JA , Wilson RS , Bienias JL , Bennett DA ((2006) ) Body mass index in older persons is associated with Alzheimer disease pathology. Neurology 67: , 1949–1954. |
[7] | Davies K , Kingston A , Robinson L , Hughes J , Hunt JM , Barker SA ((2014) ) Improving retention of very old participants in longitudinal research: Experiences from the Newcastle 85+ Study. PLoS One 9: , E108370. |
[8] | Ferreira JP , Kearney SA , Watfa G , Zohra L , Felblinger J , Boivin JM , Benetos A ((2017) ) Memory alterations and white matter hyperintensities in elderly patients with hypertension: The ADELAHYDE-2 Study. J Am Med Dir Assoc 18: , 451. |
[9] | Molitch ME , Defronzo RA , Franz MJ , Keane WF , Mogensen CE , Parving HH ((2003) ) Diabetic nephropathy. Diabetes Care 26 Suppl 1: , S94–S98. |
[10] | Wenger E , Martensson J , Noack H , Bodammer NC , Kuhn S , Schaefer S ((2014) ) Comparing manual and automatic segmentation of hippocampal volumes: Reliability and validity issues in younger and older brains. Hum Brain Mapp 35: , 4236–4248. |
[11] | Scheltens P , Leys D , Barkhof F , Huglo D , Weinstein HC , Vermersch P ((1992) ) Atrophy of medial temporal lobes on MRI in “probable” Alzheimer’s disease and normal ageing: Diagnostic value and neuropsychological correlates. J Neurol Neurosurg Psychiatry 55: , 967–972. |
[12] | Whitwell JL , Crum WR , Watt HC , Fox NC ((2001) ) Normalization of cerebral volumes by use of intracranial volume: Implications for longitudinal quantitative MR imaging. AJNR Am J Neuroradiol 22: , 1483–1489. |
[13] | Wahlund LO , Barkhof F , Fazekas F , Bronge L , Augustin M , Sjogren M ((2001) ) A new rating scale for age-related white matter changes applicable to MRI And CT. Stroke 32: , 1318–1322. |
[14] | Watfa G , Marteau JB , Rossignol P , Kearney-Schwartz A , Fay R , Bracard S ((2010) ) Association study of gene polymorphisms involved in vascular alterations in elderly hypertensives with subjective memory complaints. Dement Geriatr Cogn Disord 30: , 440–448. |
[15] | Lackland DT , Roccella EJ , Deutsch AF , Fornage M , George MG , Howard G ((2014) ) Factors influencing the decline in stroke mortality: A statement from the American Heart Association/American Stroke Association. Stroke 45: , 315–353. |
[16] | Faraco G , Iadecola C ((2013) ) Hypertension: A harbinger of stroke and dementia. Hypertension 62: , 810–817. |
[17] | Iadecola C ((2013) ) The pathobiology of vascular dementia. Neuron 80: , 844–866. |
[18] | Petrovitch H , White LR , Izmirilian G , Ross GW , Havlik RJ , Markesbery W ((2000) ) Midlife blood pressure and neuritic plaques, neurofibrillary tangles, and brain weight at death: The HAAS. Honolulu-Asia Aging Study. Neurobiol Aging 21: , 57–62. |
[19] | Sparks DL , Scheff SW , Liu H , Landers TM , Coyne CM , Hunsaker JC III ((1995) ) Increased incidence of neurofibrillary tangles (NFT) in non-demented individuals with hypertension. J Neurol Sci 131: , 162–169. |
[20] | Joas E , Backman K , Gustafson D , Ostling S , Waern M , Guo X ((2012) ) Blood pressure trajectories from midlife to late life in relation to dementia in women followed for 37 years. Hypertension 59: , 796–801. |
[21] | Iadecola C ((2014) ) Hypertension and dementia. Hypertension 64: , 3–5. |
[22] | de la Torre JC ((2012) ) Cardiovascular risk factors promote brain hypoperfusion leading to cognitive decline and dementia. Cardiovasc Psychiatry Neurol 2012: , 367516. |
[23] | Romero JR , Beiser A , Seshadri S , Benjamin EJ , Polak JF , Vasan RS ((2009) ) Carotid artery atherosclerosis, MRI indices of brain ischemia, aging, and cognitive impairment: The Framingham Study. Stroke 40: , 1590–1596. |
[24] | Zhou Z , Zhang Y , Zhu C , Sui J , Wu G , Meng Z ((2012) ) Cognitive functions of carotid artery stenosis in the aged rat. Neuroscience 219: , 137–144. |
[25] | Haring B , Omidpanah A , Suchy-Dicey AM , Best LG , Verney SP , Shibata DK ((2017) ) Left ventricular mass, brain magnetic resonance imaging, and cognitive performance: Results from The Strong Heart Study. Hypertension 70: , 964–971. |
[26] | Pase MP , Herbert A , Grima NA , Pipingas A , O’Rourke MF ((2012) ) Arterial stiffness as a cause of cognitive decline and dementia: A systematic review and meta-analysis. Intern Med J 42: , 808–815. |
[27] | Waldstein SR , Rice SC , Thayer JF , Najjar SS , Scuteri A , Zonderman AB ((2008) ) Pulse pressure and pulse wave velocity are related to cognitive decline in the Baltimore Longitudinal Study of Aging. Hypertension 51: , 99–104. |
[28] | Lilamand M , Vidal JS , Plichart M , De Jong LW , Duron E , Hanon O ((2016) ) Arterial stiffness and medial temporal lobe atrophy in elders with memory disorders. J Hypertens 34: , 1331–1337. |
[29] | Hughes TM , Kuller LH , Barinas-Mitchell EJ , Mackey RH , Mcdade EM , Klunk WE ((2013) ) Pulse wave velocity is associated with beta-amyloid deposition in the brains of very elderly adults. Neurology 81: , 1711–1718. |
[30] | Raji CA , Ho AJ , Parikshak NN , Becker JT , Lopez OL , Kuller LH ((2010) ) Brain structure and obesity. Hum Brain Mapp 31: , 353–364. |
[31] | Whitmer RA , Gustafson DR , Barrett-Connor E , Haan MN , Gunderson EP , Yaffe K ((2008) ) Central obesity and increased risk of dementia more than three decades later. Neurology 71: , 1057–1064. |
[32] | Volkow ND , Wang GJ , Telang F , Fowler JS , Goldstein RZ , Alia-Klein N ((2009) ) Inverse association between BMI and prefrontal metabolic activity in healthy adults. Obesity 17: , 60–65. |
[33] | Buchman AS , Wilson RS , Bienias JL , Shah RC , Evans DA , Bennett DA ((2005) ) Change in body mass index and risk of incident Alzheimer disease. Neurology 65: , 892–897. |
[34] | Power BD , Alfonso H , Flicker L , Hankey GJ , Yeap BB , Almeida OP ((2013) ) Changes in body mass in later life and incident dementia. Int Psychogeriatr 25: , 467–478. |
[35] | Vidoni ED , Townley RA , Honea RA , Burns JM ((2011) ) Alzheimer disease biomarkers are associated with body mass index. Neurology 77: , 1913–1920. |
[36] | Van PC ((2004) ) Relationship between hippocampal volume and memory ability in healthy individuals across the lifespan: Review and meta-analysis. Neuropsychologia 42: , 1394–1413. |
[37] | Ystad MA , Lundervold AJ , Wehling E , Espeseth T , Rootwelt H , Westlye LT ((2009) ) Hippocampal volumes are important predictors for memory function in elderly women. BMC Med Imaging 9: , 17. |
[38] | Khlif MS , Egorova N , Werden E , Redolfi A , Boccardi M , Decarli CS ((2019) ) A comparison of automated segmentation and manual tracing in estimating hippocampal volume in ischemic stroke and healthy control participants. Neuroimage Clin 21: , 101581. |

