
Zibotentan, an Endothelin A Receptor Antagonist, Prevents Amyloid-β-Induced Hypertension and Maintains Cerebral Perfusion
Abstract
Cerebral blood flow is reduced in Alzheimer’s disease (AD), which is associated with mid-life hypertension. In people with increased cerebral vascular resistance due to vertebral artery or posterior communicating artery hypoplasia, there is evidence that hypertension develops as a protective mechanism to maintain cerebral perfusion. In AD, amyloid-β (Aβ) accumulation may similarly raise cerebral vascular resistance by upregulation of the cerebral endothelin system. The level of endothelin-1 in brain tissue correlates positively with Aβ load and negatively with markers of cerebral hypoperfusion such as increased vascular endothelial growth factor. We previously showed that cerebroventricular infusion of Aβ40 exacerbated pre-existing hypertension in Dahl rats. We have investigated the effects of 28-day cerebral infusion of Aβ40 on blood pressure and heart rate and their variability; carotid flow; endothelin-1; and markers of cerebral oxygenation, in the (normotensive) Wistar rat, and the modulatory influence of the endothelin A receptor antagonist Zibotentan (ZD4054). Cerebral infusion of Aβ caused progressive rise in blood pressure (p < 0.0001) (paired t-test: increase of 3 (0.1–5.6) mmHg (p = 0.040)), with evidence of reduced baroreflex responsiveness, and accumulation of Aβ and elevated endothelin-1 in the vicinity of the infusion. Oral Zibotentan (3 mg/kg/d, administered for 31 d) abrogated the effects of Aβ40 infusion on baroreflex responsiveness and blood pressure, which declined, although without reduction in carotid blood flow, and Zibotentan caused uncoupling of the positive linear relationship between endothelin-1 and vascular endothelial growth factor, which as a sensor of tissue oxygenation would be expected to increase if there were hypoperfusion.
INTRODUCTION
Cerebral blood flow (CBF) is reduced approximately 40% in Alzheimer’s disease (AD) [1]. Early AD is associated with a distinct distribution of hypoperfusion, notably affecting the precuneus, posterior cingulate, and superior parietal cortex [2, 3], consistent with the regional distribution of amyloid-β (Aβ). In elderly people at high risk of AD, reduction in CBF precedes cognitive decline, brain atrophy, significant deposition of amyloid, or decline in Aβ42 in the cerebrospinal fluid [4]. In longitudinal studies, lower CBF is associated with increased dementia risk and disease severity, and decline in CBF predicts conversion to dementia [5–7]. Increased cerebrovascular resistance, an elevated ratio of blood pressure (BP) to CBF, occurs earlier and is more widespread, than altered CBF in AD [8–11].
Non-amyloid small vessel disease, and cerebral amyloid angiopathy (CAA), may contribute to reduced CBF in AD. However, the regions most affected by these pathologies (occipital cortex in CAA, and deep cerebral white and grey matter structures in small vessel disease) are not those with the earliest or most marked reduction in CBF in AD. Compared to age-matched controls, people with mutations causing autosomal dominant AD had a greater volume of white matter hyperintensities, up to two decades before the onset of dementia [12]; only 21% of the association was related to microbleeds (a marker of CAA) [13]. The main contributors to the reduction in CBF are probably regulatory rather than structural abnormalities of the cerebral vasculature.
Some of these abnormalities are probably mediated by indirect effects of intracerebral Aβ peptides. Aβ40 induces vasoconstriction in isolated arteries and on application to mouse cortex [14–16]. Functional hyperemia and endothelium-dependent relaxation are attenuated by Aβ through a mechanism shown to involve Nox2-derived reactive oxygen species [17–19]. Aβ also causes pericyte death in vitro and in Tg2576 mice [20–22]. Loss of pericytes from the cerebral cortex is associated with reduced CBF in mice [23, 24], and postmortem biochemical evidence of reduced oxygenation of human brain tissue [25]. Aβ was shown to induce generation of the potent vasoconstrictor endothelin-1 (EDN1) through activation of the Aβ-binding receptor for advanced glycosylation end products (RAGE) in Tg2576 mice, producing a reduction in CBF [26, 27]. We found that EDN1 is significantly elevated in AD cortex, as is one of the catalytic enzymes involved in its production, endothelin-converting enzyme-2 (ECE-2). Exogenous Aβ peptides upregulated the endothelin system in vitro: Aβ42 increased neuronal ECE-2, and Aβ40 caused elevation of ECE-1 in endothelial cells [28–31]. We also demonstrated increased ECE-1 activity and EDN1 level in blood vessels from postmortem AD brain [31].
Mid-life hypertension is associated with later-life AD. A recent study of 8,000 participants showed that systolic BP (SBP) above normal but below the conventional treatment threshold, at 50 years (but not 60 or 70 years), is associated with an increased risk of dementia [32]. However, the direction of causality has come under question, with recent evidence that hypertension may be a protective response to cerebral hypoperfusion linked to Aβ accumulation within the brain [33–35], analogous to the development of renovascular hypertension or pulmonary hypertension in people with reduced renal or pulmonary perfusion. Warnert et al. [33] found that people with hypoplasia of the vertebral arteries or posterior part of the circle of Willis were at elevated risk of developing hypertension, and that cerebral vascular resistance increased before the development of hypertension, which was associated with an increase in sympathetic nerve activity. We studied the systemic hemodynamic effects of cerebroventricular infusion of Aβ in the Dahl salt-sensitive (Dahl/SS) rat [35]. The Dahl/SS rat develops hypertension on a high-salt diet and the hypertension was exacerbated by intracerebroventricular infusion of Aβ. The elevated blood pressure was associated with autonomic imbalance and reduced cardiac baroreflex gain.
Together, the evidence suggests that an Aβ-mediated increase in EDN1 contributes, at least in part, to reduced CBF in AD, and may induce a rise in systemic BP. A further mechanism by which Aβ may mediate cerebral vasoconstriction is by changes to the renin-angiotensin system (RAS), particularly by increased production of the vasoconstrictors angiotensin II and III [36–38]. Anti-hypertensive medications are being trialed to prevent cognitive decline [38]. The evidence is unclear as to whether a reduction in incident dementia is associated only with certain classes of anti-hypertensives: only calcium-channel blockers and renin-angiotensin system blockers had a significant effect in one analysis [39], but another meta-analysis found that people with hypertension had a reduced risk of developing dementia when taking any class of anti-hypertensive medication [40]. The direct vasodilatory effect on the cerebral vasculature of these commonly prescribed antihypertensive mediations is potentially a major confounder in studies investigating the impact of lowering BP on the AD risk. There are no comparable human data for EDN1 receptor antagonists (ERAs), although the EDNRA receptor subtype mediates EDN1-induced vasoconstriction, and the cerebrovascular effects of this peptide have the potential to be modified by an EDNRA antagonist [41].
We have now examined the effects of Zibotentan (an EDNRA antagonist) on systemic BP, CBF, autoregulation, and other vasoregulatory pathways in a rat model of Aβ-mediated cerebral vasoconstriction. Our hypothesis was that parenchymal infusion of Aβ would, through increased production of EDN1, increase cerebral vascular resistance, affecting autonomic function and causing elevation of systemic BP, and that these effects would be ameliorated by Zibotentan.
METHODS
Animals
All procedures in this study were conducted in accordance with the UK Home Office Guidelines on Animals (Scientific Procedures) Act of 1986 and approved by University of Bristol Ethical Review Committee. Male Wistar rats, aged 12–14 weeks at the start of the experiments, with a mean initial weight of 343 g (range 251–503 g; for details, see Table 1), were sourced from Harlan, UK. The rats were housed at a constant 22°C under a 14:10 light/dark cycle with free access to food and water. All data were analyzed and are reported in accordance with ARRIVE guidelines [42]. The choice of a rat model rather than a transgenic mouse had several practical advantages for this study, their larger size allowing for complex surgical procedures and their greater brain tissue volume facilitating our measurement of the multiple proteins of interest by adaptation of assays previously optimized for human postmortem tissue. Further, rats more closely reflect cardiovascular physiology of humans, and are better suited to the study of blood flow, BP, and heart rate variability.
Table 1
Mean blood pressure pre- and post-Aβ/saline infusion
| Group | N | Weight* (g) | MBP: baseline (mmHg) | MBP:+zib (mmHg) | MBP: post-infusion final week (mmHg) |
| Aβ | 20 | 343 (321–365) | 102 (98–107) | – | 105 (99–111)a |
| Saline | 11 | 352 (325–379) | 104 (101–107) | – | 104 (99–109) |
| Aβ+zib | 12 | 341 (299–383) | 109 (103–115) | 102 (95–109)b | 104 (95–114) |
| Saline+zib | 12 | 338 (327–349) | 105 (102–108) | 100 (97–102)c | 101 (96–107) |
Telemetry data (mean blood pressure; MBP) in Aβ- and saline-infused groups. Mean values (95% CI). *Weight prior to telemetry surgery at 12–14 weeks of age. Pre-infusion baseline MBP for all groups. MBP following Zibotentan (+zib) administration for Aβ+zib and saline+zib groups (measured pre-infusion). Post-infusion data for final week of Aβ or saline infusion (day 22–28). Baseline MBP did not differ significantly between groups (one-way ANOVA, p = 0.249). Final week MBP was significantly higher than baseline in the Aβ group (paired t-test, ap = 0.0404). MBP was significantly reduced in the Aβ+zib group (Tukey’s multiple comparisons test, bp = 0.0049) and the saline+zib group (Tukey’s, cp < 0.0001) following administration of Zibotentan.
Study design
Simple randomization was used to assign animals to one of four groups: Aβ40-infused not on Zibotentan (Aβ); Aβ40-infused on Zibotentan (Aβ+zib); saline; and saline+zib. A power calculation was performed to determine the minimum number (n = 10) of rats required for each experimental group to test the primary hypotheses (that Zibotentan would prevent Aβ-induced hypertension); based on our previous experience, the SD of BP measurements in a typical cohort of rats is ≤5% of the mean, so that for fixed-effects omnibus one-way ANOVA, groups of 10 animals will give us >99% power to detect an effect size (f) of 1.0 across all groups, and 90% power (at the p < 0.05 level) to detect mean differences of 7% between groups. An additional 10 rats in the Aβ infusion group were used to confirm the consistency of the common carotid artery flow probe measurements.
Experimental procedures
General surgical procedure
Wistar rats were first anesthetized with 5% halothane, then weighed and fully anesthetized with ketamine (60 mg/kg) and medetomidine (250 μg/kg) by injection. The nociceptive pinch reflex was used to assess the level of anesthesia before, and at frequent time points during each procedure, and anesthetic was topped up as necessary. Body temperature was monitored and maintained at 37°C using a heat blanket. Aseptic technique was used for surgery. Immediately after surgery, the rats were given 1 mL of lactated Ringer’s solution subcutaneously, then a subcutaneous injection of atipamezole (1 mg/kg). Post-operatively they were housed individually in clean cages, and for 2-3 days were given one daily dose of the analgesic, meloxicam.
Telemetry device implantation
A radio-telemetry device (Data Sciences International (DSI), MN, US) was implanted according to the method of Waki et al. [43] and as previously described [35]. Baseline physiological data were collected for five to seven days, prior to mini-osmotic pump surgery.
Zibotentan administration
Zibotentan, ZD4054, provided by AstraZeneca, is a potent, highly specific antagonist of EDNRA (IC50 = 13 nM) [44], with no effect at EDNRB. This is the first preclinical study addressing the potential therapeutic use of Zibotentan for AD.
Rats that were randomly assigned to the Aβ+zib or saline+zib group were administered Zibotentan in their drinking water (27.6 μg/mL, a dose of ∼3 mg/kg/d) from 3 days prior to mini-osmotic pump implantation (used to deliver Aβ40/saline). This dose was calculated prior to the study, based on the observation that 350 g Wistars drank an average 38 mL water/d. Rats assigned to the Aβ or saline group were given normal drinking water without the drug.
Mini-osmotic pump implantation
4-week infusion of either Aβ40 (human Aβ1-40; AnaSpec; San Jose, CA, USA) or saline into the brain parenchyma was performed using the Alzet® osmotic pump model 2004 and Alzet® brain infusion kit 1 (both Charles River). We directed infusions into the brain parenchyma as our previous study of Aβ40 infusion into the right lateral ventricle indicated rapid clearance [35].
Mini-osmotic pump implantation and brain cannula placement were performed after a minimum of five days’ recovery from implantation of the telemetry device, and five to seven days of baseline recording for each animal. Prior to surgery, the mini-osmotic pump and vinyl catheter were filled with Aβ40 solution – 1 mg stock solution prepared in 0.35% acetonitrile and diluted to the final concentration of 1 mg/mL (231 μM) in sterile saline, or saline with acetonitrile to the same final concentration. Following anesthesia, the rat was placed in a stereotaxic frame with a clamp arm holding a fine stainless-steel cannula (part of brain infusion kit) in position. The skull was exposed, and the cannula positioned and implanted below the skull surface into the caudate-putamen (striatum) at AP – 1.0 mm, L – 3.0 mm, D 5.0 mm, attached to the catheter and pump and fixed in position with dental cement. The attached pump was implanted subcutaneously with the tubing passing subcutaneously through the scapular region. The tubing remained slack to allow free head movement. The infusion rate of 0.25 μl/h administered 6 μg/d of Aβ40 for 28 d.
Carotid flow probe implantation
On day 17 of infusion, a flow probe was implanted around the right common carotid artery to allow absolute blood flow measurement through this artery during the final days of infusion (days 20–28). Following anesthesia, a midline ventral neck incision exposed the common carotid artery, which was carefully isolated. A strip of surgical mesh (approximately 2 cm width) was passed underneath the exposed artery. A flow probe (1PRB; Transonic Systems, USA) with side cable orientation was placed around the artery, the metal slide closed, and signal verified after the addition of lubricating jelly (Surgilube®, Savage Laboratories, USA) to the inside of the probe head and connection to the flowmeter: a T402 Dual Channel Flow Console fitted with 2 x TS420 Perivascular Flowmeter Module (-P) via a CRA10-S-CRA10 10-pin cable (both Transonic Systems). The metal slide of the probe reflector was cleaned of lubricant and sealed with a small amount of cyanoacrylate glue. The artery and acoustic portion of the probe were soaked in saline to avoid glue contamination. The surgical mesh was wrapped around the artery and probe and sutured in place to minimize intervening build-up of fibrotic tissue. The probe cable was anchored subcutaneously and then passed around the neck to exit at the back of the animal just above the scapular region. The connector side of the probe was held in place using a plastic cuff (Transonic Systems) sutured to the skin.
The flow probe signal returns 2-3 d following implantation. Our first reading was taken at 3 d. Daily readings were obtained during infusion days 20–28. Rats were fully awake, placed on the investigators lap in surrounding cloth to minimize stress, and the flowmeter connector plugged in for 2-3 min for each reading. Average carotid flow (mL/min) was measured and BP recorded simultaneously to allow calculation of vascular conductance (mL/min/mmHg).
Telemetry monitoring and data analysis
As described previously [35], the telemetry system used in this study measures pulsatile arterial pressure. Spike2 software was used to derive heart rate (HR), respiratory rate (RR), SBP, diastolic (DBP), and mean BP (MBP) from this waveform. The telemetry device was switched on five days after implantation to record for 5 to 7 d (baseline). Mean HR, RR, SBP, DBP, and MBP were calculated for each 24 h period and an average baseline value for each parameter was determined. For those rats given Zibotentan, this was added to the drinking water after the baseline measurements, 3 d before infusions of Aβ40 or saline were started. After mini osmotic pump implantation surgery, telemetry measurements were recorded continuously from 3–28 d, at a digital sampling frequency of 1000 Hz, and the average for each 24 h period was determined relative to mean baseline values.
HR and BP variability analysis
Spike2 software was used for spectral analysis of HR and SBP variability (HRV and SBPV), and to produce an index of cardiac baroreceptor reflex gain (BRG) sensitivity, according to previously-described methods [35].
Brain tissue collection and preparation
Whole brain was collected immediately postmortem on day 28 of infusion and kept on ice. After removal of the brainstem and cerebellum, tissue homogenates were separately prepared from anterior, intermediate, and posterior regions of each cerebral hemisphere, yielding 6 homogenates from each brain. Tissue was weighed and transferred to 2 mL screw-cap tubes with 6–8 ceramic beads and 1% SDS homogenization buffer (1% SDS, 10 mM Tris base pH 6, 0.1 mM NaCl, 1 μM PMSF, 1 μg/mL Aprotinin) added (either 1 mL or 1.25 mL depending on weight, ∼20% w/v). Tissue was homogenized for 4 x 20 s at 6000 rpm in a Precellys® homogenizer (Bertin Technologies, from Stretton Scientific, UK), with incubation on ice after each homogenization. Homogenates were centrifuged at 12,470 g for 20 min at 4°C, and the supernatant aliquoted and stored at –80°C immediately.
Measurement of vascular endothelial growth factor (VEGF), proteolipid protein 1 (PLP1), EDN1, and Aβ40 in brain homogenates by sandwich ELISA
VEGF, PLP1, EDN1, and Aβ40 in brain homogenates were quantified using commercial sandwich ELISA kits, according to manufacturers’ instructions, with slight modifications to optimize kits for use with rat brain homogenates. The accuracy of the ELISAs were validated by spike-and-recovery testing using rat brain homogenates spiked with standards: recovery was between 80–120%, with linearity on serial sample dilution. The ELISA kits used were Rat VEGF Immunoassay and Human Amyloid β (aa1-40) Immunoassay (both Quantikine® ELISA, R&D Systems); Rat ET-1 (Endothelin 1) ELISA Kit (Elabscience®); and Rat PLP1/Myelin PLP ELISA Kit (Sandwich ELISA, LifeSpan BioSciences, Inc.). Plates arrived pre-coated with antibody. Homogenate sample aliquots were defrosted and centrifuged at 16,602 g for 5 min at 4°C. All reagents were brought to room temperature before use (except Aβ40 conjugate which remained at 4°C). Samples were diluted to working dilution in sample diluent provided (1 in 10 for VEGF and Aβ40, and 1 in 15 for EDN1 and PLP1), and added to the plate in duplicate wells. Standard serial dilutions were carried out according to manufacturers’ recommendations, and assayed in duplicate wells, with the addition of an extra serial dilution for the VEGF ELISA so all samples fell within the range of the standard curve. Incubation times and temperatures, washing, secondary antibody dilutions, substrate and stop solution were all as in the manufacturers’ protocols. The optical density was read at 450 nm (FLUOstar OPTIMA plate reader; BMG Labtech, Germany). Blanks, of standard diluent and standard diluent containing the same dilution of lysis buffer as the sample, were subtracted from the standard readings and sample readings respectively. Sample readings all fell within the standard curve readings for each assay and the average of the duplicates was interpolated from the relevant standard curve to calculate concentration. Carry-over samples were used to check inter-plate variability and adjustments were made as necessary. Sample concentrations were adjusted for homogenate tissue weight per volume of lysis buffer added when the homogenates were prepared.
Measurement of myelin-associated glycoprotein (MAG) by dot blot
MAG in rat brain homogenates was quantified by dot blot. Aliquots of homogenate samples were defrosted and centrifuged at 16,602 g for 20 min to remove particulates and diluted 1 in 40 in Tris-buffered saline (TBS). The Bio-Dot™ apparatus (Bio-Rad, CA, USA) containing a nitrocellulose membrane was assembled according to the manufacturer’s instructions, and the vacuum applied to tighten the manifold. With the vacuum switched off and the apparatus exposed to air, 100 μl of sample was added to wells in duplicate and left for 1 h. Aliquots of a standard (recombinant human MAG protein, Abcam ab187760) serially diluted in TBS in the range 8–140 ng/mL were also added and used to construct an 8-point standard curve for each blot. Blanks were filled with 100 μl TBS. The Bio-Dot™ apparatus was disassembled and the membrane washed briefly in TBS containing 0.05% Tween (TBS-T) before being blocked with 10% milk powder (MP) in TBS-T for 1 h at room temperature, on a rocking platform. The membrane was incubated overnight at 4°C, on a rocking platform, with anti-MAG C-terminal primary antibody that recognizes MAG (mouse monoclonal, Abcam ab89780), diluted 1 in 5000 in 5% MP/TBS-T. From this point, all incubations and washes were carried out at room temperature, on a rocking platform. The membrane was washed in three changes of TBS-T (each for 30 min), incubated with peroxidase-conjugated anti-mouse secondary antibody (WestVision™, Vector Labs) diluted 1 in 5000 in 5% MP/TBS-T for 1 h, followed by 3 further 30-min washes in TBS-T. Immobilon Western Chemiluminescent HRP (Millipore) reagents A and B were mixed 1:1 5 min before addition to the membrane, which was incubated for 5 min. Immunolabelled dots were imaged using an automated imager and ImageLab software (both Bio-Rad), and the integrated density calculated for each dot. The local background (one-pixel width outside of the dot) was subtracted and each sample interpolated from the standard curve. Carry-over samples were used to adjust for inter-blot variability, and each sample concentration was adjusted for homogenate tissue weight per volume of lysis buffer added.
Statistical methods
Statistical analyses were performed in GraphPad Prism 6. All data sets were assessed for normality of distribution by the D’Agostino and Pearson test. Data are presented to 3 significant figures.
To compare the effects of Aβ and saline infusion, the telemetry data collected following infusion were adjusted relative to the corresponding sample pre-infusion baseline mean and analyzed for each 24-h period; best-fit regression lines (for change in physiological parameter over time post-infusion) were compared by sum-of-squares F-test. Post-infusion MBP from the Aβ and saline infusion groups in the final week of infusion were compared by paired samples t-test to the respective baseline data. The post-infusion MBP from the Zibotentan-administered Aβ and saline infusion groups was compared by one-way ANOVA with Tukey’s post-hoc tests to 1) pre-infusion baseline and 2) after Zibotentan administration, also measured pre-infusion.
Carotid flow and carotid vascular conductance and biochemical data from brain tissue homogenates were compared between the four groups by one-way ANOVA with either selective (Sidak’s) or Tukey’s post-hoc tests, where specified. Some biochemical data were analyzed by comparison to zero (i.e., no protein of interest) by Wilcoxon signed rank. A Wilcoxon matched-pairs signed rank was used to compare protein levels between brain hemispheres of the same animal, or to compare protein presented as ratios to the hypothetical median value 1, i.e., no change between hemispheres. For non-parametric biochemical data, specifically the ratio of MAG:PLP1, comparison between groups was made by Kruskal-Wallis. The relationship between different protein measurements was examined by Pearson’s correlation.
RESULTS
Baseline data
Mean baseline weights and experimental numbers, as well as mean baseline telemetry data are presented in Table 1.
Outcomes and estimation
Post-infusion telemetry
Aβ infusion causes hypertension. We compared the changes in MBP, SBP, DBP, HR, and RR over baseline in Aβ- (n = 20) and saline- (n = 11) infused rats from 5 to 28 d post-infusion. BP increased over time in the Aβ-infused rats but decreased in the saline-infused animals. Comparison of best-fit regression lines by sum-of-squares F-test showed that the increases in MBP and SBP were highly significant (p < 0.0001 for both) and the increase in DBP was also significant (p = 0.0056). There were also increases with time in the Aβ-infused group in both HR (p = 0.0040) and RR (p < 0.0001), but little change in either measure in the saline group (Supplementary Figure 1).
Changes in telemetry measurements occurred gradually over the 28 d infusion period and were maximal during the final of week of infusion. Paired t-tests were used to compare telemetry measures in the final week (22–28 d, inclusive) relative to pre-infusion baseline in the same animals (Table 1). In the two groups not given Zibotentan, MBP showed a mean (95% confidence interval (CI)) increase of 2.85 (0.139–5.56) mmHg (p = 0.0404) with Aβ infusion but no change with saline. SBP also increased by 3.44 (0.667–6.21) mmHg (p = 0.0177) during Aβ infusion but there was no change in DBP; RR increased by 9.87 (0.107–19.6) br/min (p = 0.0478); there was no change in HR. None of the telemetry measurements changed during saline infusion.
Zibotentan prevents Aβ-induced hypertension. We compared the changes in HR, RR, MBP, SBP, and DBP with respect to the post-Zibotentan, pre-infusion means in Zibotentan-administered Aβ- (n = 6), and saline- (n = 9) infused Wistar rats from 5 to 28 d post-infusion (Supplementary Figure 2). Comparison of best-fit regression lines by sum-of-squares F-test revealed no differences in MBP (p = 0.986), SBP (p = 0.671), DBP (p = 0.976), HR (p = 0.580), or RR (p = 0.201) between the Aβ- and saline-infused groups.
In the rats given Zibotentan, repeated measures one-way ANOVA with Tukey’s multiple comparisons testing was used to compare telemetry pre-infusion measurements at baseline, after Zibotentan (+zib) and in the final week post-infusion (22–28 d) (Table 1). In both groups there was a significant decline in MBP following administration of Zibotentan (Aβ+zib: n = 5, Tukey’s p = 0.0049; saline+zib: n = 9, p < 0.0001), but no further change post-infusion. There were no significant differences found in SBP, DBP, HR, or RR in either group post-infusion. The pre-infusion telemetry data were grouped (Aβ+zib plus saline+zib; n = 14) to examine the effects of Zibotentan, before and after administration of the drug. There was a significant mean (95% CI) decline in MBP of 5.90 (4.75–7.05) mmHg (paired t-test, p < 0.0001) between baseline and following the administration of Zibotentan. Similarly, there was a significant mean decline in SBP of 5.91 (4.70–7.11) mmHg (p < 0.0001) following Zibotentan administration. DBP also fell significantly, by 5.69 (4.26–7.12) mmHg (p < 0.0001) after Zibotentan administration. HR rose significantly, by 9.23 (6.21–12.3) bpm (p < 0.0001) following Zibotentan administration and RR was also elevated, by 4.62 (1.89–7.35) br/min.
Carotid flow and carotid vascular conductance
Common carotid artery blood flow (CF) was measured by vascular probe with simultaneous measurement of SBP, providing data for the calculation of carotid vascular conductance (CVC). It was technically challenging to obtain these measurements and data could only be obtained from a subset of animals (Aβ: n = 12; saline: n = 5; Aβ+zib: n = 5; saline+zib: n = 5). One-way ANOVA revealed significant variation in mean CF between the four groups (p = 0.0114). However, selective post-hoc testing (Sidak’s multiple comparison test) revealed no difference between Aβ- and saline-infused groups, no difference between Aβ and Aβ+zib groups, and no difference between the Aβ+zib and saline+zib groups (Fig. 1a).
Fig.1
Carotid flow and carotid vascular conductance following Aβ40 or saline infusion, with and without Zibotentan administration. Carotid flow (CF) and carotid vascular conductance (CVC) in Aβ40 (n = 12), Aβ40 + Zibotentan (n = 5), saline (n = 5), and saline + Zibotentan (n = 5) groups. Each data point represents the individual mean value over a period of 5–7 d. Mean and 95% CI lines are shown. A one-way ANOVA was performed to compare mean CF and CVC between groups. Significant variation was found in (a) mean CF (F3,23 = 4.61, p = 0.0114), but post-hoc testing did not reveal significant differences between groups. We also found a significant variation in (b) mean CVC (F3,23 = 5.34, p = 0.0061). Sidak’s post-hoc test showed a significant mean difference (95% CI) of –0.0199 (–0.0376, –0.00218) mL/min/mmHg between the Aβ+zib and saline+zib groups (p = 0.0245). The datasets were grouped to look at the effects of Zibotentan irrespective of infusion (i.e., Aβ/saline+zib versus Aβ/saline). An unpaired t-test revealed (c) significantly higher CF (p = 0.0046) in the Zibotentan-administered animals (mean 7.20 (95% CI 6.29–8.11) mL/min, n = 10), compared to those not given Zibotentan (5.80 (5.27–6.33) mL/min, n = 17). There was also (d) a small, but significant, elevation of CVC (p = 0.0478) in Zibotentan-administered animals (0.0635 (0.0522–0.0750) mL/min/mmHg) compared to those not given the drug (0.0532 (0.0479–0.0584) mL/min/mmHg).
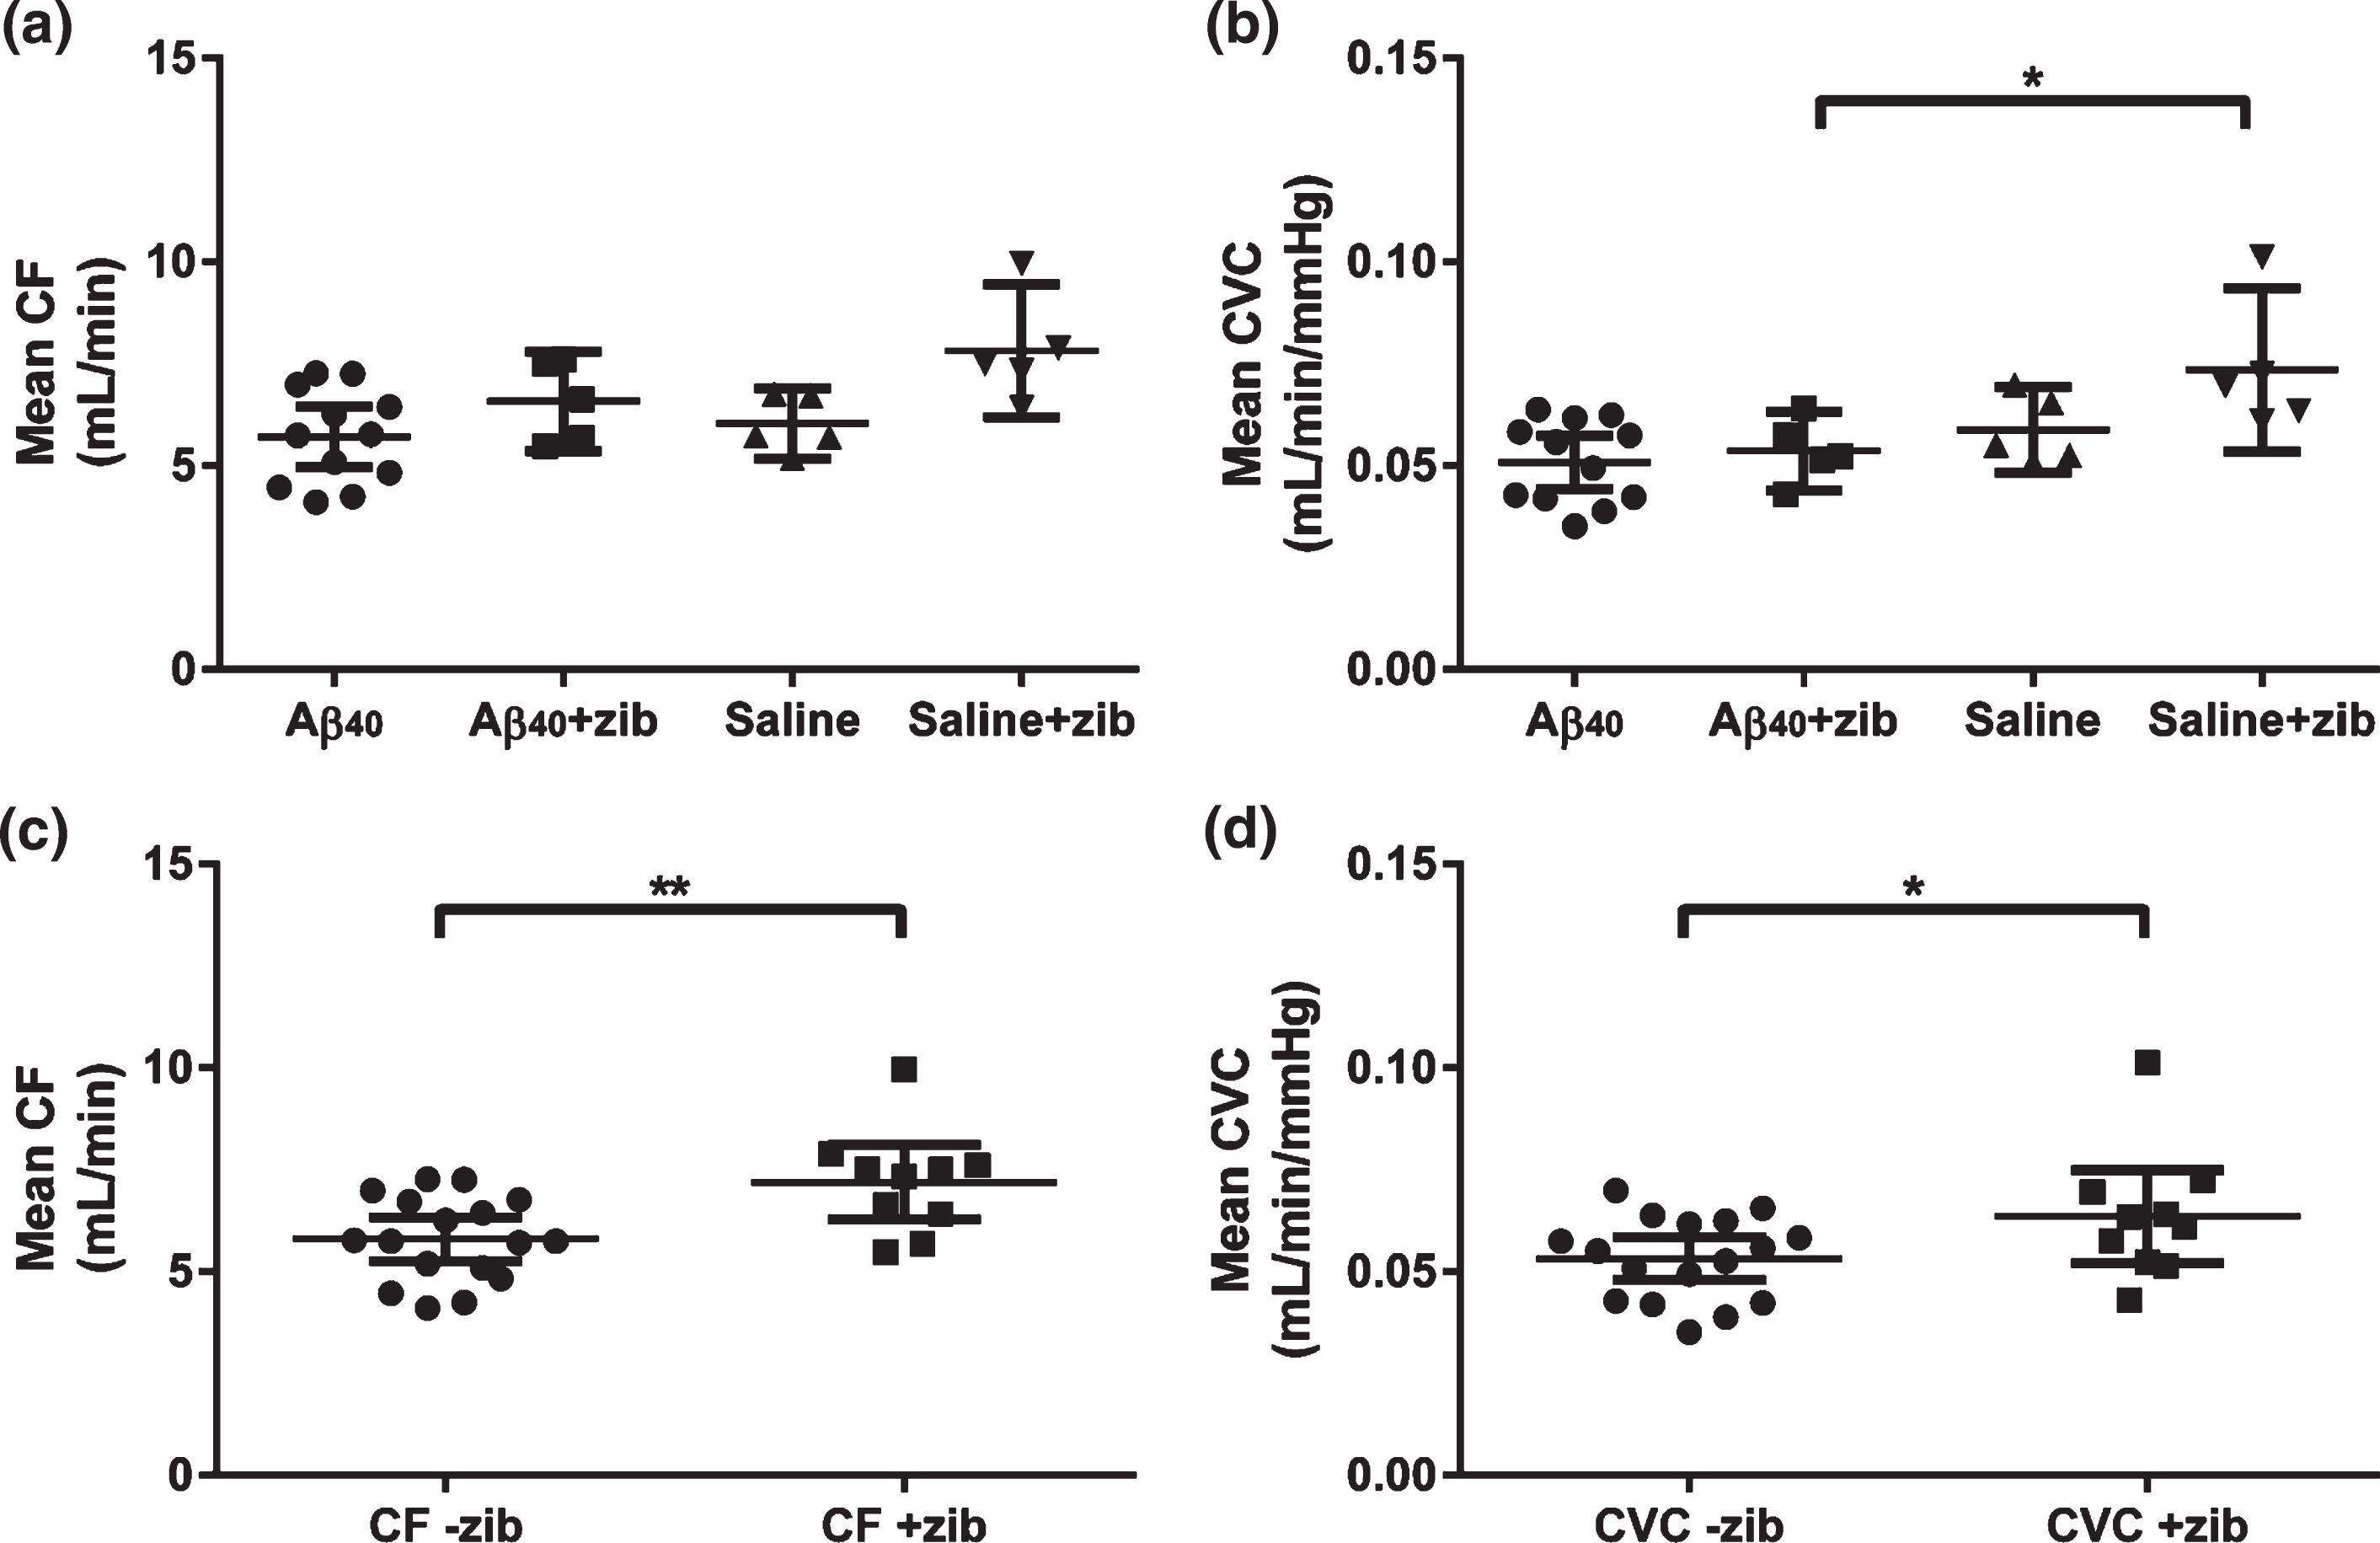
Mean CF and simultaneous SBP measurements were used to calculate mean CVC (mL/min/mmHg). Significant variation was found in mean CVC (p = 0.0061). Sidak’s multiple comparison post-hoc tests revealed no difference between the Aβ- and saline-infused groups, or between Aβ and Aβ+zib groups. However, CVC was significantly higher in the saline+zib than the Aβ+zib group (p = 0.0245; Fig. 1b). There was no significant variation in SBP between groups.
The datasets were grouped to look at the effects of Zibotentan irrespective of infusion (i.e., Aβ/saline+zib versus Aβ/saline-zib). An unpaired t-test revealed significantly higher CF (p = 0.005; Fig. 1c) in the Zibotentan-administered animals (mean 7.197, 95% CI 6.29–8.11 mL/min, n = 10) than in those not given Zibotentan (mean 5.80, 95% CI 5.27–6.33 mL/min, n = 17). There was also a small but significant elevation of CVC (p = 0.0478; Fig. 1d) in Zibotentan-administered animals (mean 0.0636, 95% CI 0.0522–0.0750 mL/min/mmHg) compared to those not given the drug (mean 0.0532, 95% CI 0.0479–0.0584 mL/min/mmHg).
HRV, SBPV, and BRG
HRV and SBPV following Aβ and saline infusion. We analyzed HRV and SBPV from 5 to 28 d post-infusion (Aβ: n = 12; saline: n = 9). A sum-of-squares F-test comparison tested the null hypothesis (H0) that a single linear regression line could fit the combined data sets. There was no significant difference in the very low frequency (VLF), low frequency (LF), or high frequency (HF) component of HRV between the saline- and Aβ-infused rats (Supplementary Figure 3a–c). We found a significant increase in the VLF (p = 0.0105) but not the LF or HF component of SBPV between the saline- and Aβ-infused rats (Supplementary Figure 3d–f).
BRG following Aβ and saline infusion. We compared the relative change in BRG over baseline in a random subset of animals (Aβ: n = 6; saline: n = 6) from 5 to 28 d post-infusion. There was a progressive decline in positive ramps (p = 0.0025) during Aβ infusion but negligible change during saline infusion (Supplementary Figure 3 g). Both the Aβ and saline groups showed a progressive decline in negative ramps; the difference between the groups was not significant (Supplementary Figure 3 h). These results suggest a reduction in the sensitivity of the baroreflex response over time, particularly during Aβ infusion.
Aβ40 detected after parenchymal infusion in brain tissue homogenates
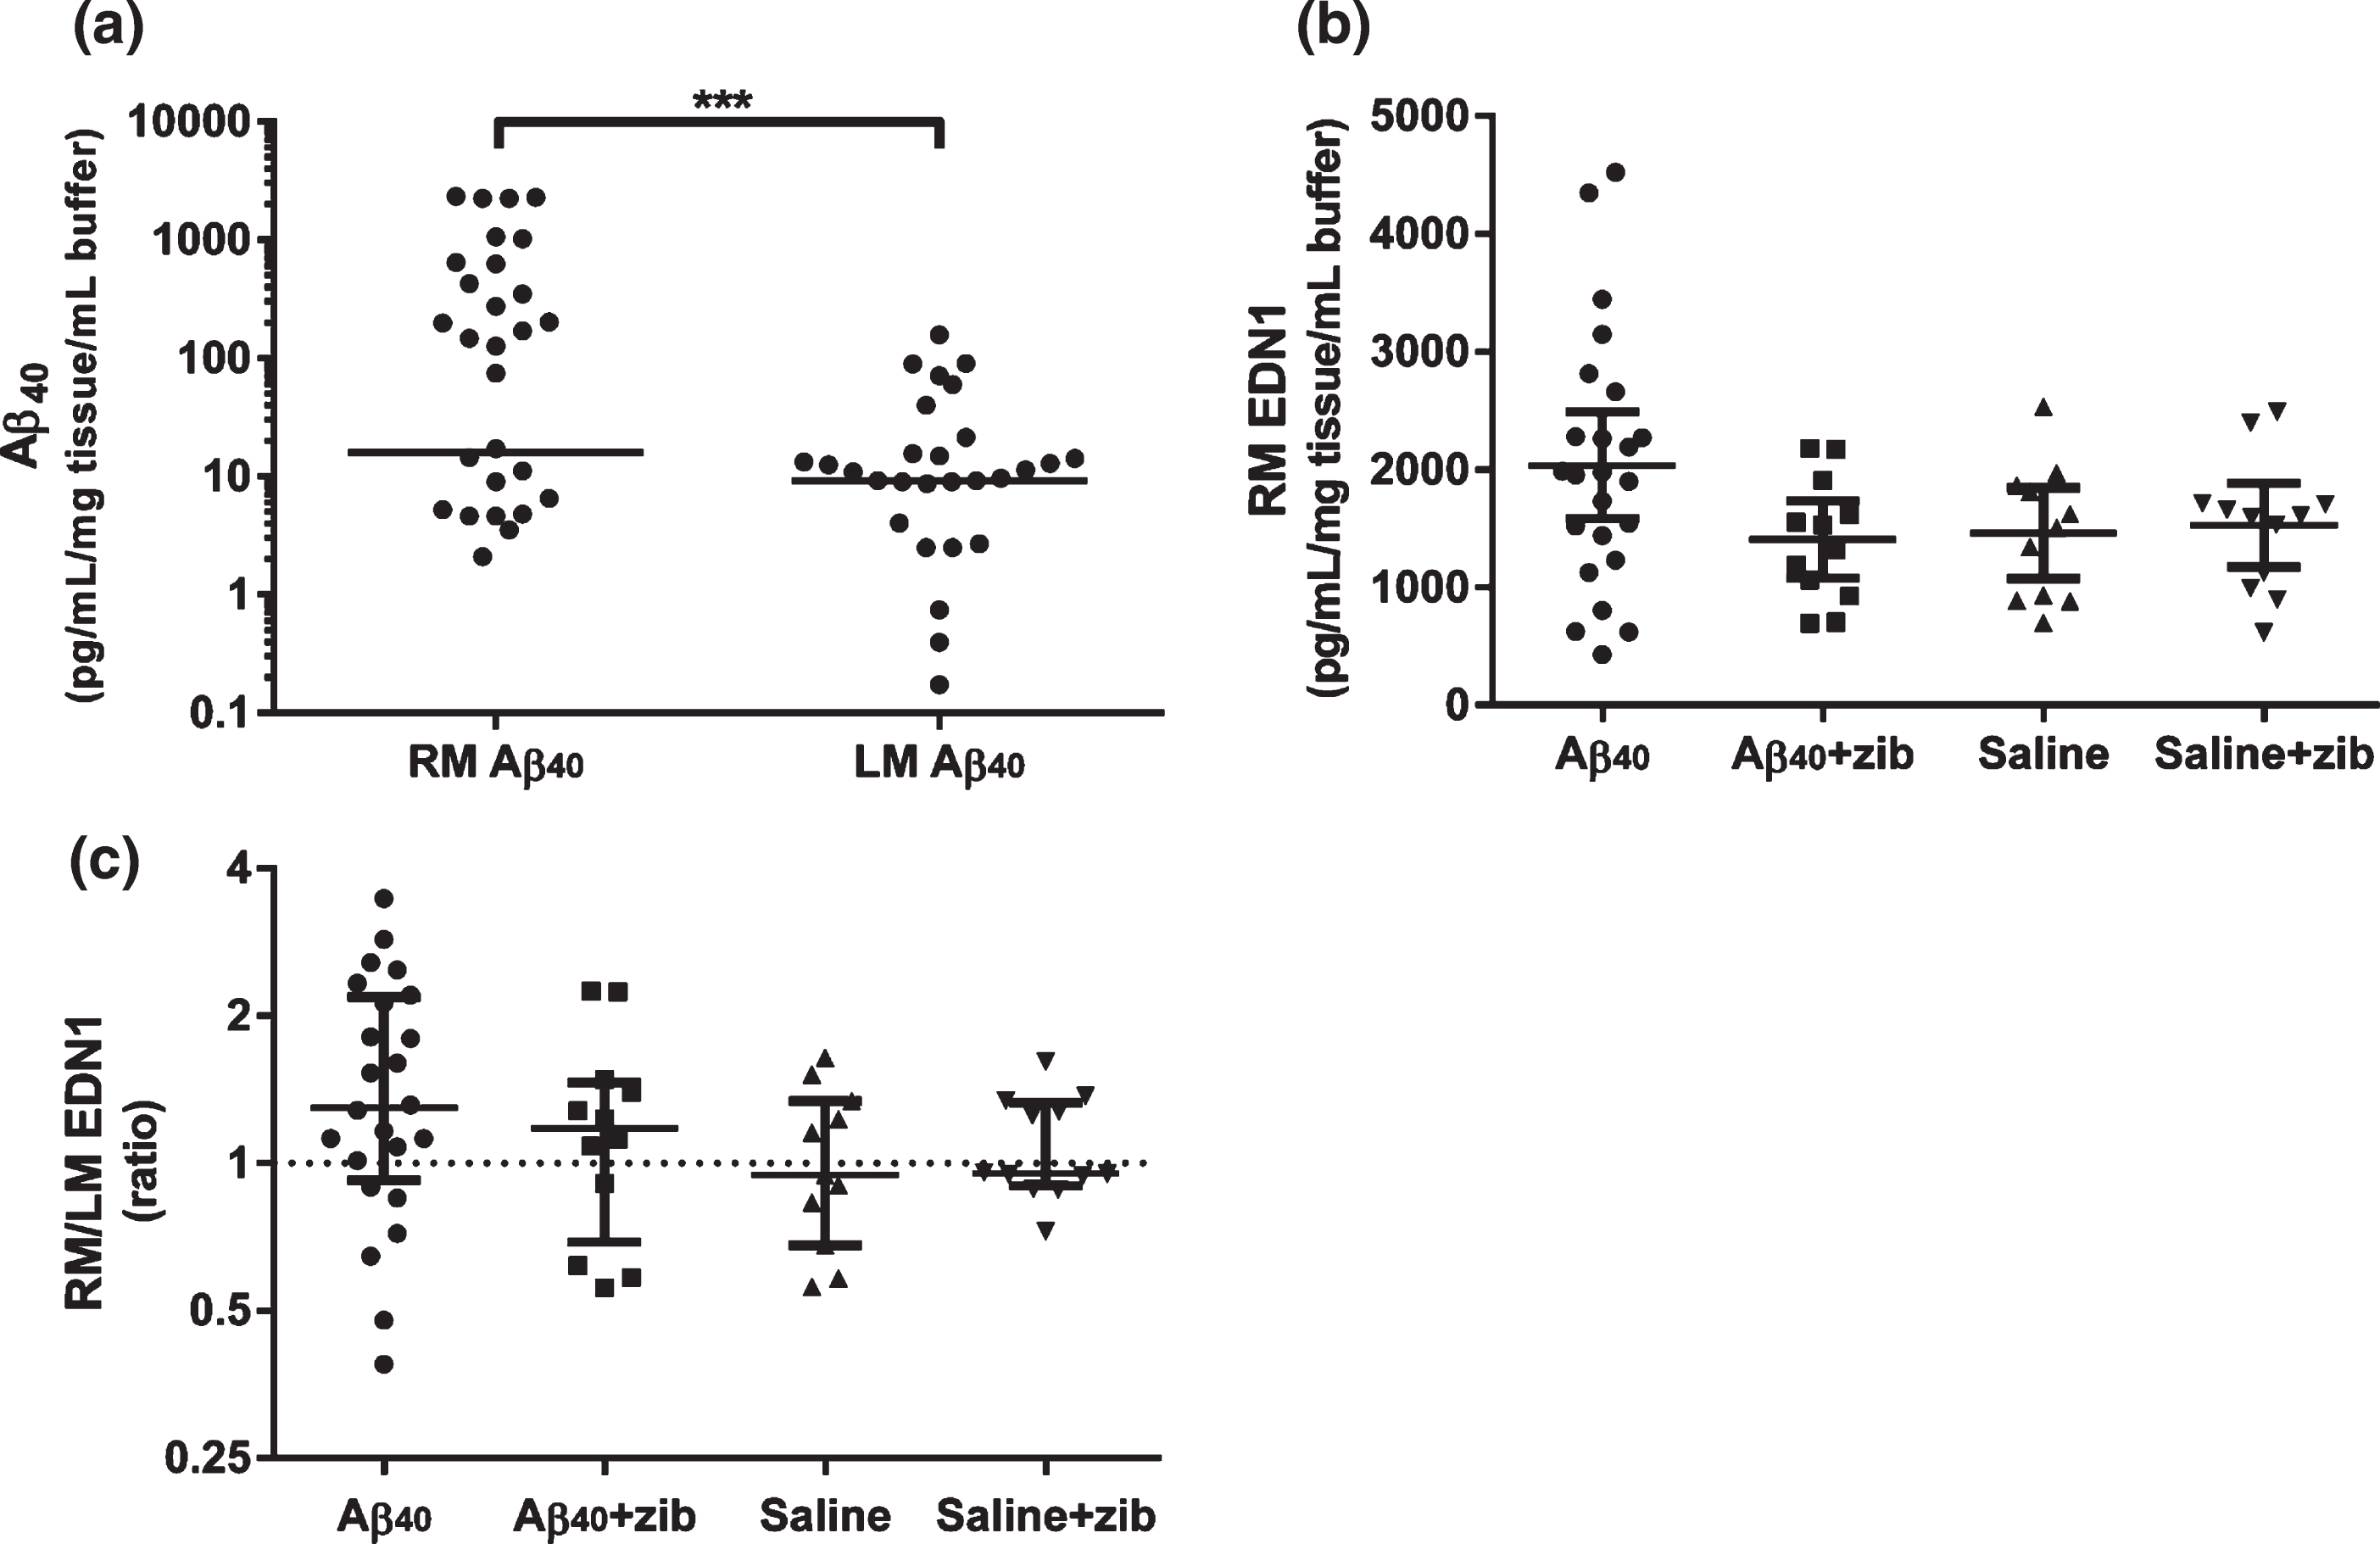
Aβ40 (measured by sandwich ELISA) remaining in the brain after completion of the infusions was measured in homogenates of the middle (mid-coronal) third of the right and left hemispheres (RM and LM). No Aβ40 was detected in the saline-infused animals. The level of Aβ40 in the animals that had received parenchymal Aβ40 infusion (n = 36;±Zibotentan) varied considerably, and in some instances fell below the limit of detection. However, the median Aβ40 level was significantly higher than zero (as was the case for saline-treated animals) in both hemispheres (Wilcoxon signed-rank; p < 0.0001). A Wilcoxon matched-pairs signed rank test also showed a significant elevation of RM over LM Aβ40 (median difference 4.78 (95.9% CI 0–202); p = 0.0003; Fig. 2a).
Fig.2
Aβ40 and EDN1 levels in brain tissue homogenates. Aβ40 and EDN1 levels measured by sandwich ELISA in rat brain tissue in homogenates from the left middle (LM) and right middle (RM; infusion site) hemispheres. a) Aβ40 in RM (n = 36) and LM (n = 35) samples. The horizontal lines show median Aβ40 levels; zero values (below detection limit) are not shown on the logarithmic scale (LM: n = 7/35, RM: n = 8/36) but were included for analysis. We used a Wilcoxon signed rank to test the null hypothesis (H0) that the median Aβ40 in each hemisphere did not differ significantly from zero. The median Aβ40 level was elevated in both hemispheres: RM group (15.9 (range 0–2335); W = 406, p < 0.0001) and LM group (9.16 (0-158); W = 406, p < 0.0001). A Wilcoxon matched-pairs signed rank test found a significant median of differences of 4.78 between RM and LM (n = 35; 95.9% CI: 0–202; p = 0.0003), reflecting a higher level of Aβ40 close to the site of infusion. Graph (b) shows RM mean EDN1 level (pg/mL/mg tissue/mL buffer) and 95% CI, and (c) shows the RM/LM EDN1 ratio, with values, median±inter-quartile range (IQR) plotted on a logarithmic scale. One-way ANOVA with Sidak’s multiple comparisons test was used to compare EDN1 levels. No significant variation was found in (b) RM (F3,55 = 2.40, p = 0.078) or LM (F3,55 = 0.182, p = 0.908; not shown). Although not significant, the greatest change in EDN1 was found in the RM of the Aβ40 group. We compared the median (c) EDN1 ratio of RM/LM in each group to the hypothetical median ratio (H0 = 1) by Wilcoxon signed-rank test. The median (1.30 (IQR 0.923–2.18)) was significantly elevated in the Aβ40 group (W = 188; p = 0.006) but not significantly altered in the other groups.
Elevation of EDN1 RM/LM ratio after Aβ infusion
The level of EDN1 was measured in homogenates of the middle third of the left and right hemispheres. We compared EDN1 in the four groups by one-way ANOVA. There was no significant variation in RM or LM between the groups. Sidak’s post-hoc multiple comparisons test was used to test the null hypotheses that there was no difference in EDN1 level between 1) the Aβ-infused (both Aβ and Aβ+zib) and saline-infused (both saline and saline+zib) groups, and 2) the Aβ and the Aβ+zib groups. For the first comparison, the mean (95% CI) RM EDN1 of the difference (575 pg/mL/mg tissue/mL buffer (-104-1253)) did not reach significance (p = 0.110; Fig. 2b) and there was no difference in the LM group (–78.6 pg/mL/mg tissue/mL buffer (-483-326)). For the second comparison, the mean RM EDN1 difference between Aβ and Aβ+zib groups was 630 pg/mL/mg tissue/mL buffer (–29.2–1288) which also did not quite reach significance (p = 0.063; Fig. 2b). A comparison of the median ratio of RM/LM to the hypothetical median ratio (H0 = 1; no difference between hemispheres) by Wilcoxon signed-rank test in each group revealed a significant elevated ratio of 1.30 (97.7% CI 1.01–2.12) in the Aβ-infused group (p = 0.0059; Fig. 2c) but no differences in the other three groups.
Changes in VEGF with Zibotentan administration
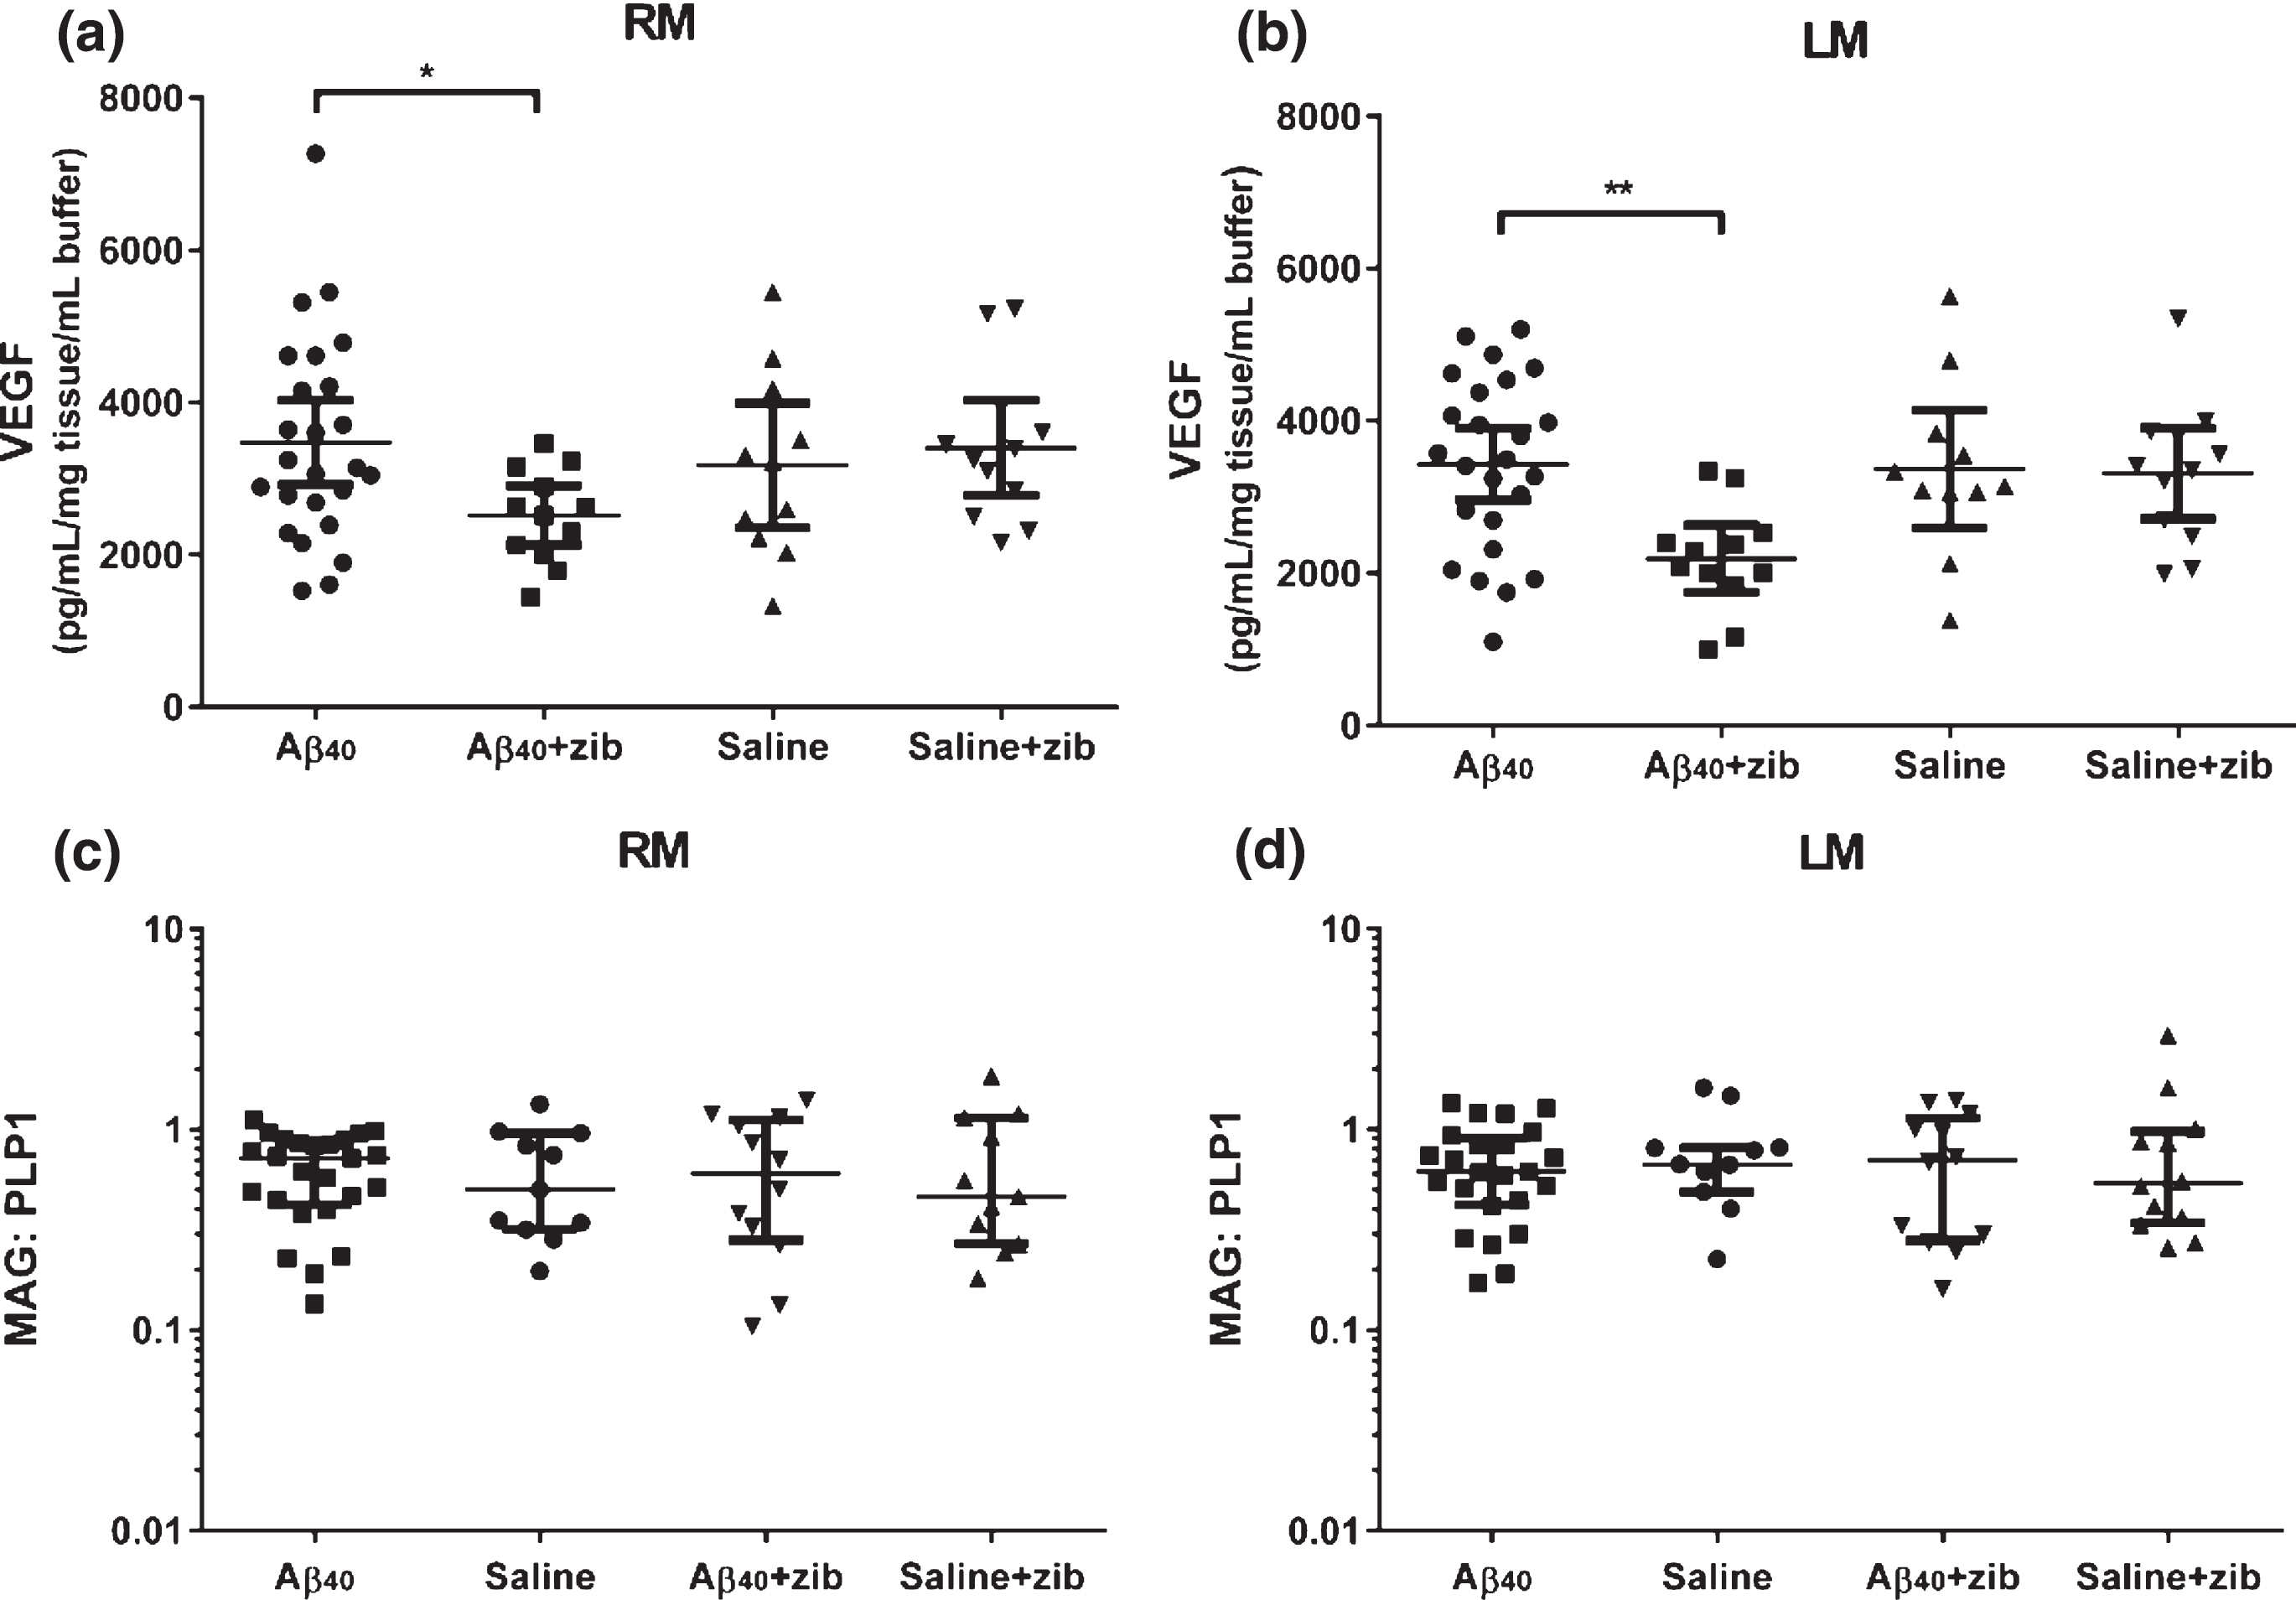
The level of VEGF in the brain was measured in homogenates of the middle third of the left and right hemispheres (LM and RM). One-way ANOVA was used to compare the levels between groups. No significant variation was found in RM (p = 0.117; Fig. 3a). We did find significant variation in LM (p = 0.0080; Fig. 3b). There were no significant differences between Aβ and saline groups in either RM or LM (Sidak’s multiple comparison test). VEGF level in the Aβ+zib group was, on average 961 pg/mL/mg tissue/mL buffer lower (95% CI: 38.1–1884) in RM, and 1,243 (410–2076) pg/mL/mg tissue/mL buffer lower in LM, than VEGF level in the Aβ group (p = 0.0398 and 0.0023 respectively). There was no significant variation in the ratio of RM/LM between groups (one-way ANOVA: p = 0.286; data not shown).
Fig.3
VEGF and MAG:PLP1 in brain tissue homogenates. VEGF and MAG:PLP1 in left middle (LM) and right middle (RM; infusion site) homogenates. VEGF (pg/mL/mg tissue/mL buffer) measured by sandwich ELISA in (a) RM and (b) LM samples, with values, mean and 95% CI shown. One-way ANOVA with Sidak’s multiple comparisons test compared VEGF in the groups. The variation in (a) RM between the 4 groups was not significant (F3,56 = 2.05, p = 0.117), and post-hoc analysis found no significant variation between the Aβ40 and saline groups. VEGF in the Aβ+zib group was, on average 961 (95% CI: 38.1–1884) pg/mL/mg tissue/mL buffer lower than in the Aβ group (p = 0.0398). We found significant variation between (b) LM homogenates (p = 0.0080), and although again there was no significant difference between the Aβ40 and saline groups (p = 0.983), VEGF in the Aβ+zib group was, on average, 1243 (410–2076) pg/mL/mg tissue/mL buffer lower than in the Aβ40 group (p = 0.0023). MAG:PLP1 in (c) RM and (d) LM samples, with the values, median and IQR shown, did not vary significantly between the 4 groups for (c) RM (H = 0.0898, p = 0.993) or (d) LM (H = 0.697, p = 0.874) samples on Kruskal-Wallis analysis.
No change in MAG:PLP1
MAG and PLP1 were measured in homogenates of LM and RM. Kruskal-Wallis comparison of the MAG:PLP1 ratio showed no significant variation between groups in either RM (p = 0.994; Fig. 3c), LM (p = 0.965; Fig. 3d), or RM/LM ratio (p = 0.874).
Relationship between EDN1 and VEGF altered by Zibotentan
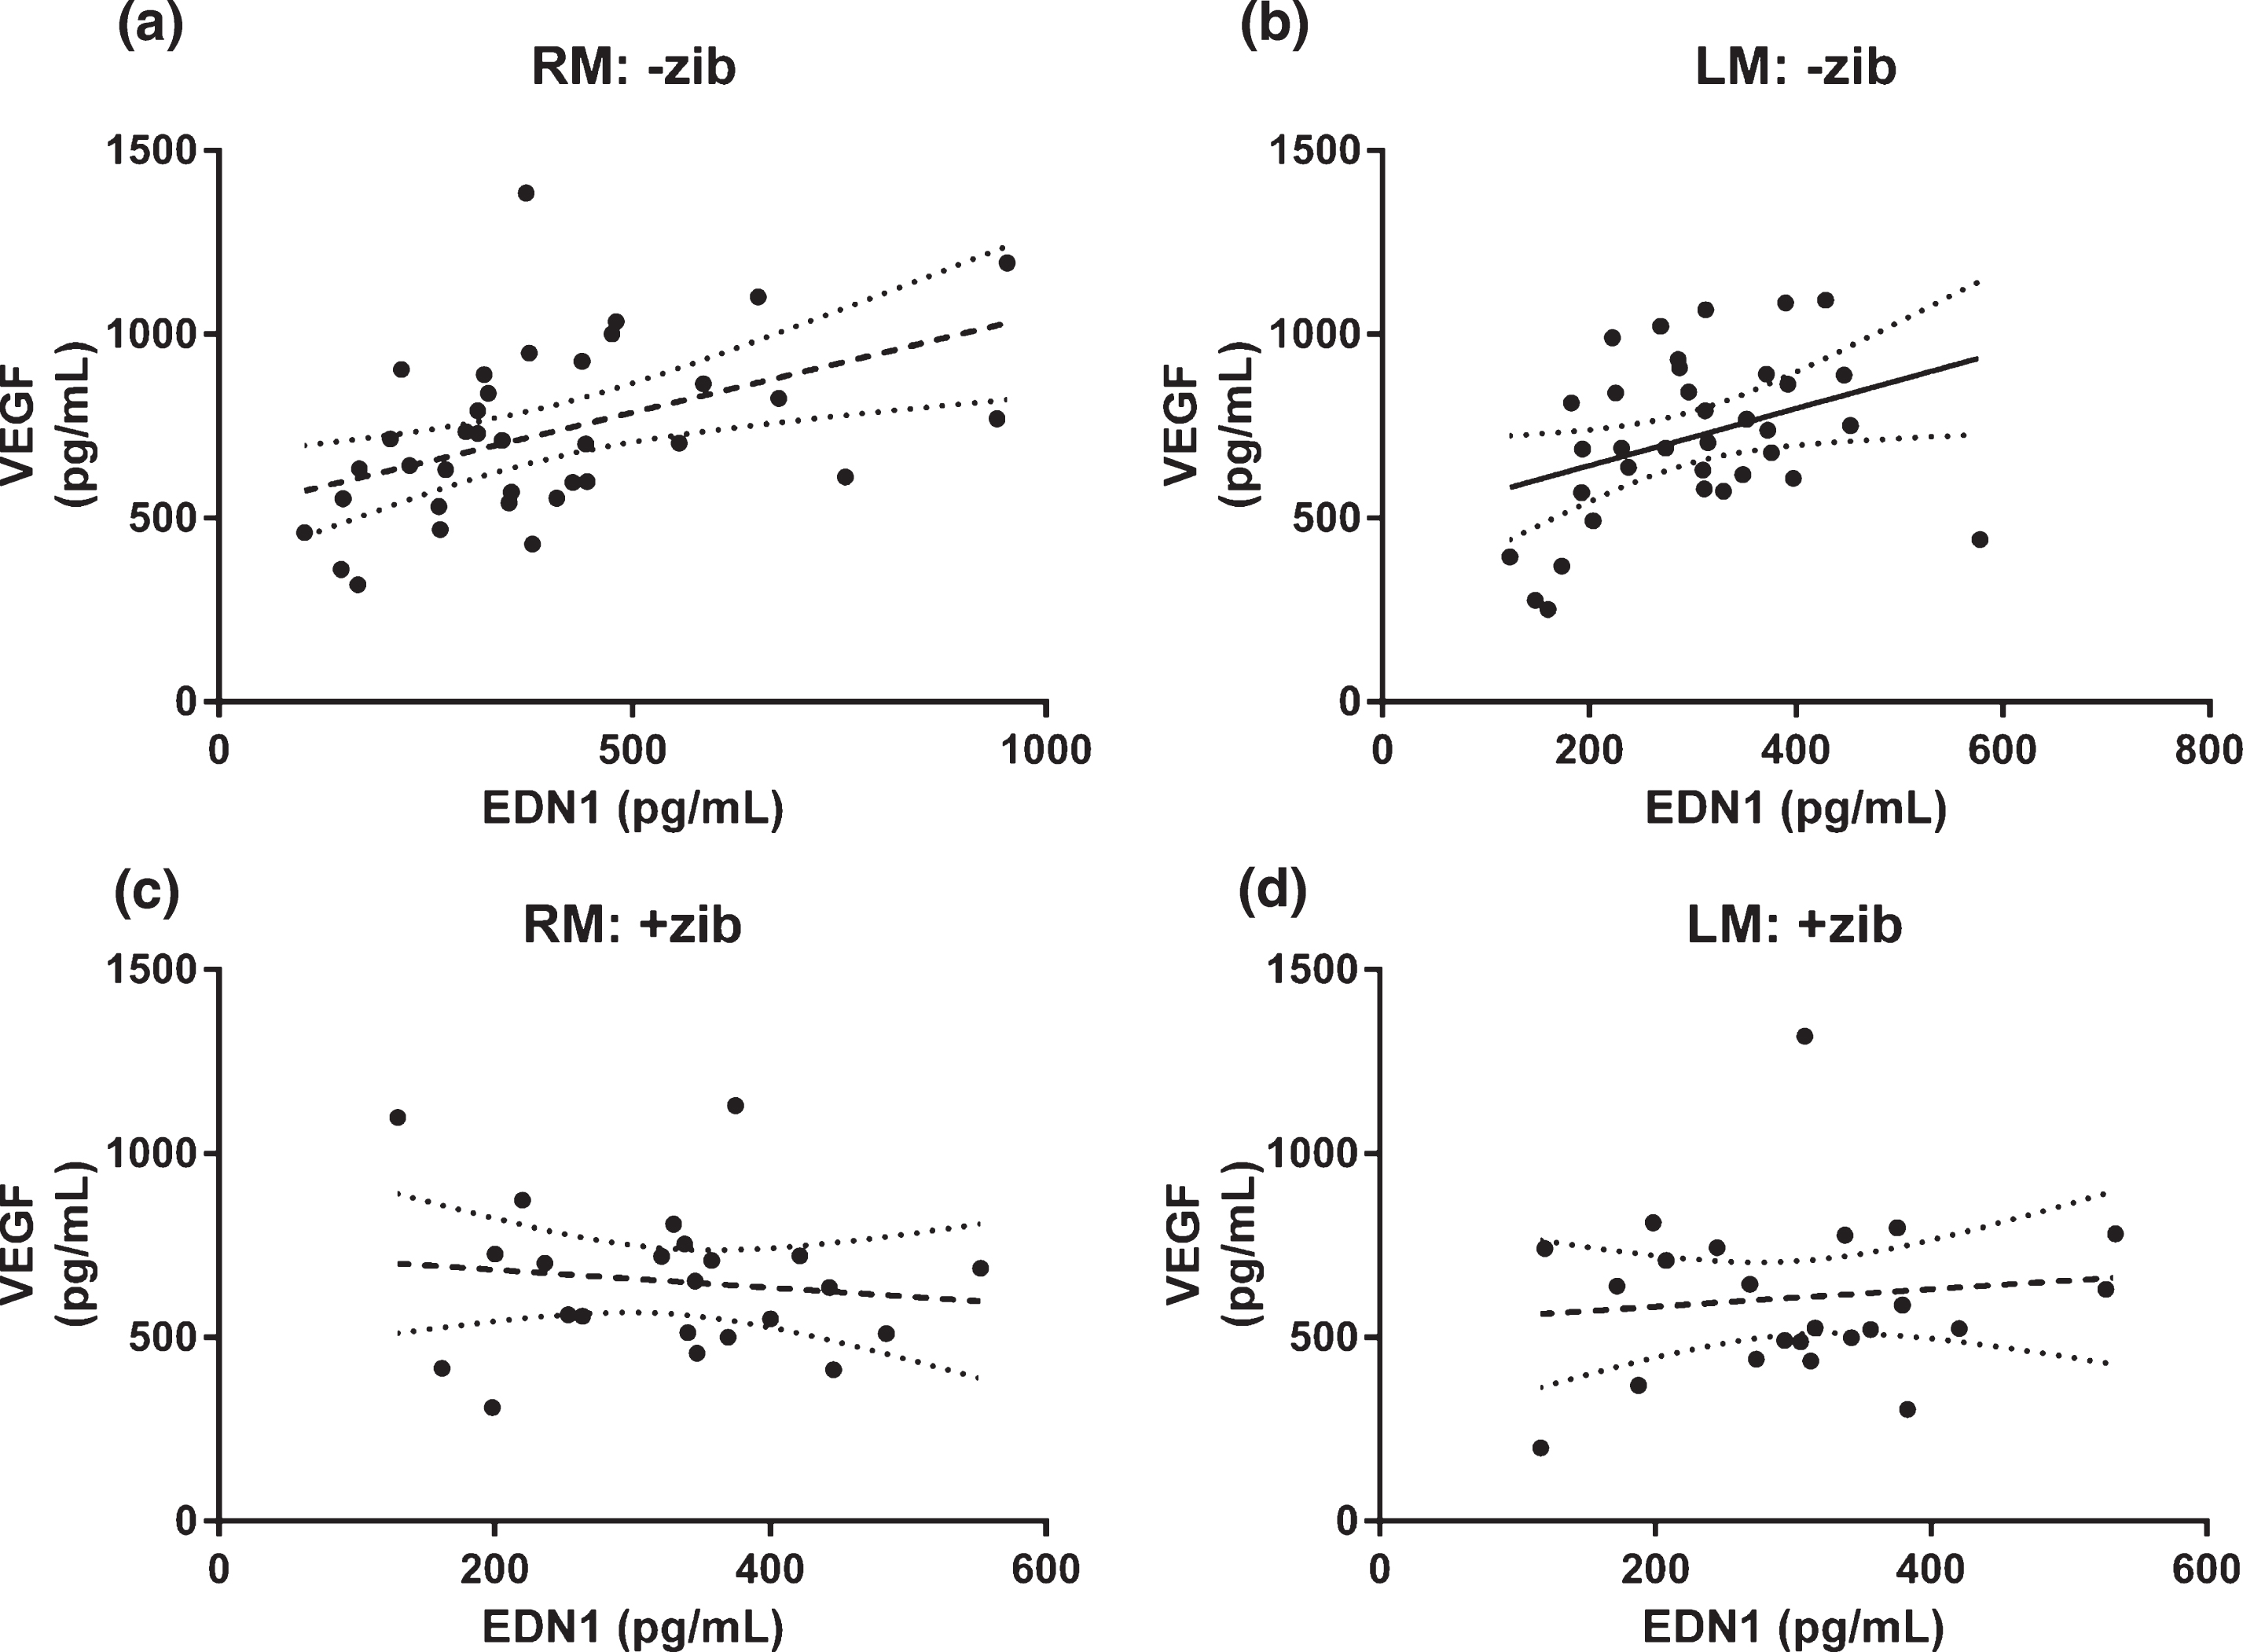
We compared the relationship between EDN1 and VEGF level in RM and LM homogenates. There was significant positive linear correlation between EDN1 and VEGF in RM (r2 = 0.124, p = 0.0063, n = 59) but not LM samples (r2 = 0.0547, p = 0.0748, n = 59) (data not shown). When we separated the samples by treatment group (i.e., without versus with Zibotentan), we found EDN1 and VEGF to be significantly correlated in both hemispheres in animals not given Zibotentan (RM: r2 = 0.221, p = 0.0038, n = 36; Fig. 4a; LM: r2 = 0.128, p = 0.0320, n = 36; Fig. 4b), but in neither hemisphere in the animals given Zibotentan (RM: r2 = 0.0168, p = 0.556, n = 23; Fig. 4c; LM: r2 = 0.0131, p = 0.604, n = 23; Fig. 4d).
Fig.4
Relationship between EDN1 and VEGF in brain tissue homogenates. Relationship between EDN1 and VEGF in left middle (LM) and right middle (RM; infusion site) homogenates. Tissue concentrations of VEGF versus EDN1 in animals given Zibotentan (+zib; n = 36) in (a) RM and (b) LM and those without Zibotentan (-zib; n = 23) for (c) RM and (d) LM samples, showing best-fit (solid) regression line + 95% CI (dotted) in all animals. There was a significant positive correlation between VEGF and EDN1 in both (a) RM and (b) LM homogenates on analysis of those animals not given Zibotentan (RM r2 = 0.470, p = 0.0038; LM r2 = 0.128, p = 0.0320) but there was no correlation between VEGF and EDN1 in either cerebral hemisphere in the Zibotentan-treated animals (RM r2 = 0.0168, p = 0.556; LM r2 = 0.0131, p = 0.604).
Adverse events
Seven rats died due to an adverse reaction to anesthesia prior to or during surgery (Aβ: 3; saline: 3; 3; saline+zib: 1). Twelve animals were excluded early from the study due to failures of the telemetry equipment (Aβ: 2; saline+zib: 1), infusion catheter (Aβ: 3; saline+zib: 1; Aβ+zib: 2), or common carotid artery blood flow probe (saline: 1; Aβ+zib: 1; saline+zib: 1). There were no adverse reactions to Zibotentan administration.
DISCUSSION
Zibotentan ameliorates Aβ-induced hypertension
In this study, we investigated the physiological effects of parenchymal Aβ40 infusion in the Wistar rat, and the extent to which they could be prevented by administration of the EDNRA antagonist, Zibotentan. Parenchymal infusion of Aβ40 in the absence of Zibotentan induced progressive, significant elevation in BP, with maintained common carotid artery blood flow (CF) and common carotid artery vascular conductance (CVC). Zibotentan caused an immediate reduction in BP and prevented a hypertensive response during infusion of Aβ40. Despite this, CF and CVC remained normal; there was uncoupling of the normal positive correlation between EDN1 and VEGF, and no biochemical evidence of reduced cerebral oxygenation despite the decline in BP, suggesting that Zibotentan maintained perfusion by preventing EDN1-mediated cerebral vasoconstriction.
Aβ infusion altered autonomic responsiveness and activity
Aβ infusion influenced several cardiovascular control mechanisms, producing elevation of the VLF components of SBPV (LF and HF were unchanged) and affecting the baroreceptor reflex. In our previous study [35], Aβ infusion altered all three components of SBPV, as well as the sensitivity of the baroreflex response, in hypertensive animals. The less pronounced changes to autonomic cardiovascular control mechanisms in the normotensive Wistars are in keeping with the smaller changes in BP (a mean increase of 3 mmHg compared to 21 mmHg in high-salt Dahls) but, as in the high-salt Dahl rats, presumably underlie the hypertensive effects of Aβ.
An increase in the VLF component of SBPV is associated with elevated sympathetic activity and consequent elevation of total peripheral resistance. In our previous study, we observed an elevation in all three component of SBPV after Aβ infusion [35]. However, in this study, we saw changes in VLF only. An increase in VLF is also found in AD patients compared to healthy controls [45]. The VLF component of SBPV is largely mediated by L-type Ca2 + channel-dependent mechanisms [46]. The precise pathway through which Aβ peptides induce L-type Ca2 + signaling in the brain is not known but elevated sympathetic activity might be expected as part of a homeostatic response to an abnormal reduction in cerebral blood flow.
Retention of Aβ after parenchymal infusion
The level of Aβ in the brain after completion of the parenchymal infusions varied, but was significantly above control values, unlike after ICV infusion in our previous study, in which Aβ had been largely cleared by the time the animals were sacrificed [35]. In some cases, the level of Aβ in parenchymally-infused animals was below our detection threshold, potentially reflecting a failure of the osmotic pump to sustain delivery of Aβ for the full 4 weeks. We did not find (and would not expect to find) an effect of Zibotentan on the level of residual Aβ in the parenchyma.
Elevated EDN1 around infusion site
Aβ40 induced elevation of EDN1 in brain tissue in the vicinity of the infusion (i.e., the middle third of right cerebral hemisphere compared to the left). In our previous study, we did not find significant changes EDN1 but that was not surprising given that Aβ was no longer detectable after the end of the 28 d infusion period [35]. In the present study, Aβ was measurable in the parenchyma in most Aβ-infused animals.
Markers of hypoperfusion (VEGF, MAG:PLP1)
There is reduction of MAG:PLP1 and elevation of VEGF in the cerebral cortex in AD, particularly in early disease (Braak tangles stage III-IV) [47, 48]. Not surprisingly, given that the young adult rats responded to Aβ by the development of hypertension which would probably have maintained perfusion even in the face of a local increase in vascular resistance, the Aβ did not cause elevation of VEGF or decline in MAG:PLP1. VEGF was significantly lower in the Aβ+zib than the Aβ group. This may reflect the fact that the rats compensate fully for the cerebrovascular effects of Aβ infusion by increasing BP to maintain CBF, but because, in addition, Zibotentan blocks the action of EDN1 on cerebrovascular EDNRA receptors the overall effect is one of overcompensation, with downregulation of VEGF.
Within the brains of rats that were not on Zibotentan, VEGF correlated positively with EDN1 level, presumably reflecting reduced perfusion due to enhanced vasoconstriction when EDN1 is higher. In the brains of rats that are on Zibotentan, however, the vasoconstrictive action of EDN1 appears to be blocked by Zibotentan, preventing hypoperfusion, as shown by the fact that EDN1 did not correlate with VEGF in these animals.
Therapeutic potential of Zibotentan in AD
EDNRA and dual EDNRA/B receptor antagonists have proved useful for the treatment of pulmonary hypertension (PH), a disease that shares hemodynamic similarities with AD, in that the increase in (pulmonary rather than cerebral) vascular resistance is associated with upregulation of EDN1, ECE-1 and changes to EDN1 receptors [49]. Patients with PH can show impaired cognitive function, associated with abnormal cerebrovascular regulation and lower cerebral oxygenation. A recent small study demonstrated cognitive improvement in PH patients receiving disease-targeted medication, of which the majority received EDNRAs [50].
The effects of EDN1 are mediated through EDNRA and EDNRB receptors. Under normal conditions, EDNRA receptors are expressed in vascular smooth muscle cells where they mediate the vasoconstrictor effects of EDN1. EDNRB receptors in endothelial cells mediate vasodilatation via the release of nitric oxide but EDNRB receptors are also expressed by vascular smooth muscles cells and can mediate vasoconstriction. Marked changes to the expression and function of EDN1 receptors have been observed under pathological conditions [51]. Our choice of a selective EDNRA antagonist was partly based on the assumption that blockade of EDNRB receptors might be counterproductive in our attempt to increase CBF. However, recent evidence suggests that dual EDNRA/B receptor blockade may have advantages over EDNRA-selective antagonism [52]. Bosentan attenuated effects of experimentally-induced diabetes on impairments of learning, memory, and endothelial function in rats [53]. In diseases such as hypertension (systemic, pulmonary), diabetes mellitus, and hypercholesterolemia, vasoconstriction-mediating endothelial EDNRA is downregulated and vasodilatation-mediating smooth muscle EDNRB upregulated. Clinical data suggest that EDNRA-selective antagonists pose a greater risk of peripheral edema. EDNRA-selective antagonism may increase vascular permeability via overactivation of EDNRBs [54]. Also, there is evidence that selective agonists which stimulate central EDNRB receptors may themselves have therapeutic potential in AD [55].
Limitations of the current study
As in our previous study [35], we used supra-physiological levels of Aβ40 to model the effects of chronic Aβ-induced cerebral hypoperfusion over a much shorter period than would apply in human AD, although the measured levels of parenchymal Aβ at the end of the study were only mildly increased. The short time-frame precludes the meaningful determination of any potential cognitive benefits of Zibotentan and will also have severely limited the sensitivity of MAG:PLP1 as an indicator of reduced cerebral oxygenation, as both of these myelin proteins have half-lives of over 3 months. Finally, both CVC and CF were measured in only a subgroup of rats during Zibotentan infusion, and the method we used to determine CF and CVC yielded global measures of hemodynamic function across relatively large perfusion territories, whereas the infusion of Aβ was localized to part of a single cerebral hemisphere. In healthy young adult rats, it is likely that vasoconstriction within part of the infused hemisphere will have induced compensatory changes in the surrounding tissue. It was noteworthy, however, that irrespective of the infusate (whether Aβ40 or saline), Zibotentan tended to ameliorate changes to CVC and CF, suggesting that EDNRA receptor blockade has the potential to increase CBF.
In this study, we used saline as the vehicle for the Aβ1-40 peptide and for the control infusions. It is possible that by dilution of bicarbonate this may have caused changes in local pH, accounting for the slight decreases in MBP, SBP, HR, and RR after saline infusion, as shown in Supplementary Figure 1. For future studies, an ideal control would be artificial cerebrospinal fluid containing mutant Aβ1-40 which can bind to RAGE but does not increase EDN1. A further limitation of this study is that we were not able to determine whether Aβ1-40 produced hypertensive effects directly via vascular actions of EDN1, or indirectly, e.g., through EDN1-mediated ischemic damage to neurons involved in the regulation of blood pressure. We speculate that Aβ42 would probably have similar cerebrovascular and hemodynamic effects to Aβ40, as it also induces elevation of cerebral EDN1 (although through upregulation of ECE-2 rather than ECE-1) [28]. However, a different methodological approach would be required to test this, as Aβ42 aggregates too readily for effective delivery by infusion pump. Finally, there were several animals that were unable to complete all the protocols, reducing statistical power for some of the analyses. A different methodological approach (probably involving a different animal model) is needed for detailed analysis of the actions of EDN1 and EDN1 receptor antagonists on regional cerebral perfusion in relation to Aβ accumulation.
Conclusions
In conclusion, we have shown that parenchymal infusion of Aβ causes progressive elevation of systemic BP in Wistar rats (that do not have pre-existing hypertension), and this effect is abrogated by administration of the specific EDNRA receptor antagonist Zibotentan, without any adverse effect on common carotid artery blood flow or cerebral oxygenation, as measured indirectly.
ACKNOWLEDGMENTS
Funding for this study was provided by the Medical Research Council (MR/K015397/1). Zibotentan (ZD4054) was provided by AstraZeneca. The British Heart Foundation (RG/12/6/29670) funded JFRP. Additional funding for equipment was provided by BRACE and Alzheimer’s Research UK.
Authors’ disclosures available online (https://www.j-alz.com/manuscript-disclosures/19-0630r2).
SUPPLEMENTARY MATERIAL
[1] The supplementary material is available in the electronic version of this article: https://dx.doi.org/10.3233/JAD-190630.
REFERENCES
[1] | Asllani I , Habeck C , Scarmeas N , Borogovac A , Brown TR , Stern Y ((2008) ) Multivariate and univariate analysis of continuous arterial spin labeling perfusion MRI in Alzheimer’s disease. J Cereb Blood Flow Metab 28: , 725–736. |
[2] | Ma HR , Pan PL , Sheng LQ , Dai ZY , Wang GD , Luo R , Chen JH , Xiao PR , Zhong JG , Shi HC ((2017) ) Aberrant pattern of regional cerebral blood flow in Alzheimer’s disease: A voxel-wise meta-analysis of arterial spin labeling MR imaging studies. Oncotarget 8: , 93196–93208. |
[3] | Wierenga CE , Hays CC , Zlatar ZZ ((2014) ) Cerebral blood flow measured by arterial spin labeling MRI as a preclinical marker of Alzheimer’s disease. J Alzheimers Dis 42 Suppl 4: , S411–419. |
[4] | Zhang N , Gordon ML , Goldberg TE ((2017) ) Cerebral blood flow measured by arterial spin labeling MRI at resting state in normal aging and Alzheimer’s disease. Neurosci Biobehav Rev 72: , 168–175. |
[5] | Alsop DC , Detre JA , Grossman M ((2000) ) Assessment of cerebral blood flow in Alzheimer’s disease by spin-labeled magnetic resonance imaging. Ann Neurol 47: , 93–100. |
[6] | Benedictus MR , Leeuwis AE , Binnewijzend MA , Kuijer JP , Scheltens P , Barkhof F , van der Flier WM , Prins ND ((2017) ) Lower cerebral blood flow is associated with faster cognitive decline in Alzheimer’s disease. Eur Radiol 27: , 1169–1175. |
[7] | Wolters FJ , Zonneveld HI , Hofman A , van der Lugt A , Koudstaal PJ , Vernooij MW , Ikram MA , Heart-Brain Connection Collaborative Research Group ((2017) ) Cerebral perfusion and the risk of dementia: A population-based study. Circulation 136: , 719–728. |
[8] | Liu J , Zhu YS , Khan MA , Brunk E , Martin-Cook K , Weiner MF , Cullum CM , Lu H , Levine BD , Diaz-Arrastia R , Zhang R ((2014) ) Global brain hypoperfusion and oxygenation in amnestic mild cognitive impairment. Alzheimers Dement 10: , 162–170. |
[9] | Yew B , Nation DA , Alzheimer’s Disease Neuroimaging I ((2017) ) Cerebrovascular resistance: Effects on cognitive decline, cortical atrophy, and progression to dementia. Brain 140: , 1987–2001. |
[10] | Nation DA , Wierenga CE , Clark LR , Dev SI , Stricker NH , Jak AJ , Salmon DP , Delano-Wood L , Bangen KJ , Rissman RA , Liu TT , Bondi MW ((2013) ) Cortical and subcortical cerebrovascular resistance index in mild cognitive impairment and Alzheimer’s disease. J Alzheimers Dis 36: , 689–698. |
[11] | den Abeelen AS , Lagro J , van Beek AH , Claassen JA ((2014) ) Impaired cerebral autoregulation and vasomotor reactivity in sporadic Alzheimer’s disease. Curr Alzheimer Res 11: , 11–17. |
[12] | Lee S , Viqar F , Zimmerman ME , Narkhede A , Tosto G , Benzinger TL , Marcus DS , Fagan AM , Goate A , Fox NC , Cairns NJ , Holtzman DM , Buckles V , Ghetti B , McDade E , Martins RN , Saykin AJ , Masters CL , Ringman JM , Ryan NS , Forster S , Laske C , Schofield PR , Sperling RA , Salloway S , Correia S , Jack C Jr. , Weiner M , Bateman RJ , Morris JC , Mayeux R , Brickman AM , Dominantly Inherited Alzheimer Network ((2016) ) White matter hyperintensities are a core feature of Alzheimer’s disease: Evidence from the dominantly inherited Alzheimer network. Ann Neurol 79: , 929–939. |
[13] | Lee S , Zimmerman ME , Narkhede A , Nasrabady SE , Tosto G , Meier IB , Benzinger TLS , Marcus DS , Fagan AM , Fox NC , Cairns NJ , Holtzman DM , Buckles V , Ghetti B , McDade E , Martins RN , Saykin AJ , Masters CL , Ringman JM , Frster S , Schofield PR , Sperling RA , Johnson KA , Chhatwal JP , Salloway S , Correia S , Jack CR Jr. , Weiner M , Bateman RJ , Morris JC , Mayeux R , Brickman AM , Dominantly Inherited Alzheimer Network ((2018) ) White matter hyperintensities and the mediating role of cerebral amyloid angiopathy in dominantly-inherited Alzheimer’s disease. PLoS One 13: , e0195838. |
[14] | Thomas T , Thomas G , McLendon C , Sutton T , Mullan M ((1996) ) beta-Amyloid-mediated vasoactivity and vascular endothelial damage. Nature 380: , 168–171. |
[15] | Zhang F , Eckman C , Younkin S , Hsiao KK , Iadecola C ((1997) ) Increased susceptibility to ischemic brain damage in transgenic mice overexpressing the amyloid precursor protein. J Neurosci 17: , 7655–7661. |
[16] | Niwa K , Carlson GA , Iadecola C ((2000) ) Exogenous Aβ1-40 reproduces cerebrovascular alterations resulting from amyloid precursor protein overexpression in mice. J Cereb Blood Flow Metab 20: , 1659–1668. |
[17] | Niwa K , Younkin L , Ebeling C , Turner SK , Westaway D , Younkin S , Ashe KH , Carlson GA , Iadecola C ((2000) ) Aβ1-40-related reduction in functional hyperemia in mouse neocortex during somatosensory activation. Proc Natl Acad Sci U S A 97: , 9735–9740. |
[18] | Iadecola C , Zhang F , Niwa K , Eckman C , Turner SK , Fischer E , Younkin S , Borchelt DR , Hsiao KK , Carlson GA ((1999) ) SOD1 rescues cerebral endothelial dysfunction in mice overexpressing amyloid precursor protein. Nat Neurosci 2: , 157–161. |
[19] | Park L , Zhou P , Pitstick R , Capone C , Anrather J , Norris EH , Younkin L , Younkin S , Carlson G , McEwen BS , Iadecola C ((2008) ) Nox2-derived radicals contribute to neurovascular and behavioral dysfunction in mice overexpressing the amyloid precursor protein. Proc Natl Acad Sci U S A 105: , 1347–1352. |
[20] | Park L , Koizumi K , El Jamal S , Zhou P , Previti ML , Van Nostrand WE , Carlson G , Iadecola C ((2014) ) Age-dependent neurovascular dysfunction and damage in a mouse model of cerebral amyloid angiopathy. Stroke 45: , 1815–1821. |
[21] | Sagare AP , Bell RD , Zhao Z , Ma Q , Winkler EA , Ramanathan A , Zlokovic BV ((2013) ) Pericyte loss influences Alzheimer-like neurodegeneration in mice. Nat Commun 4: , 2932. |
[22] | Winkler EA , Sengillo JD , Bell RD , Wang J , Zlokovic BV ((2012) ) Blood-spinal cord barrier pericyte reductions contribute to increased capillary permeability. J Cereb Blood Flow Metab 32: , 1841–1852. |
[23] | Bell RD , Winkler EA , Sagare AP , Singh I , LaRue B , Deane R , Zlokovic BV ((2010) ) Pericytes control key neurovascular functions and neuronal phenotype in the adult brain and during brain aging. Neuron 68: , 409–427. |
[24] | Winkler EA , Bell RD , Zlokovic BV ((2011) ) Central nervous system pericytes in health and disease. Nat Neurosci 14: , 1398–1405. |
[25] | Miners JS , Schulz I , Love S ((2018) ) Differing associations between Ab accumulation, hypoperfusion, blood-brain barrier dysfunction and loss of PDGFRB pericyte marker in the precuneus and parietal white matter in Alzheimer’s disease. J Cereb Blood Flow Metab 38: , 103–115. |
[26] | Deane R , Du Yan S , Submamaryan RK , LaRue B , Jovanovic S , Hogg E , Welch D , Manness L , Lin C , Yu J , Zhu H , Ghiso J , Frangione B , Stern A , Schmidt AM , Armstrong DL , Arnold B , Liliensiek B , Nawroth P , Hofman F , Kindy M , Stern D , Zlokovic B ((2003) ) RAGE mediates amyloid-β peptide transport across the blood-brain barrier and accumulation in brain. Nat Med 9: , 907–913. |
[27] | Deane R , Singh I , Sagare AP , Bell RD , Ross NT , LaRue B , Love R , Perry S , Paquette N , Deane RJ , Thiyagarajan M , Zarcone T , Fritz G , Friedman AE , Miller BL , Zlokovic BV ((2012) ) A multimodal RAGE-specific inhibitor reduces amyloid β-mediated brain disorder in a mouse model of Alzheimer disease. J Clin Invest 122: , 1377–1392. |
[28] | Palmer JC , Baig S , Kehoe PG , Love S ((2009) ) Endothelin-converting enzyme-2 is increased in Alzheimer’s disease and up-regulated by Aβ. Am J Pathol 175: , 262–270. |
[29] | Palmer JC , Barker R , Kehoe PG , Love S ((2012) ) Endothelin-1 is elevated in Alzheimer’s disease and upregulated by amyloid-β. J Alzheimers Dis 29: , 853–861. |
[30] | Palmer JC , Kehoe PG , Love S ((2010) ) Endothelin-converting enzyme-1 in Alzheimer’s disease and vascular dementia. Neuropathol Appl Neurobiol 36: , 487–497. |
[31] | Palmer JC , Tayler HM , Love S ((2013) ) Endothelin-converting enzyme-1 activity, endothelin-1 production, and free radical-dependent vasoconstriction in Alzheimer’s disease. J Alzheimers Dis 36: , 577–587. |
[32] | Abell JG , Kivimaki M , Dugravot A , Tabak AG , Fayosse A , Shipley M , Sabia S , Singh-Manoux A ((2018) ) Association between systolic blood pressure and dementia in the Whitehall II cohort study: Role of age, duration, and threshold used to define hypertension. Eur Heart J 39: , 3119–3125. |
[33] | Warnert EA , Rodrigues JC , Burchell AE , Neumann S , Ratcliffe LE , Manghat NE , Harris AD , Adams Z , Nightingale AK , Wise RG , Paton JF , Hart EC ((2016) ) Is high blood pressure self-protection for the brain? Circ Res 119: , e140–e151. |
[34] | Love S , Miners JS ((2016) ) Cerebral hypoperfusion and the energy deficit in Alzheimer’s disease. Brain Pathol 26: , 607–617. |
[35] | Tayler HM , Palmer JC , Thomas TL , Kehoe PG , Paton JF , Love S ((2018) ) Cerebral Abeta40 and systemic hypertension. J Cereb Blood Flow Metab 38: , 1993–2005. |
[36] | Miners JS , van Helmond Z , Raiker M , Love S , Kehoe PG ((2010) ) ACE variants and association with brain Aβ levels in Alzheimer’s disease. Am J Transl Res 3: , 73–80. |
[37] | Kehoe PG , Hibbs E , Palmer LE , Miners JS ((2017) ) Angiotensin-III is increased in Alzheimer’s disease in association with amyloid-beta and tau pathology. J Alzheimers Dis 58: , 203–214. |
[38] | Kehoe PG ((2018) ) The coming of age of the angiotensin hypothesis in Alzheimer’s disease: Progress toward disease prevention and treatment? J Alzheimers Dis 62: , 1443–1466. |
[39] | Rouch L , Cestac P , Hanon O , Cool C , Helmer C , Bouhanick B , Chamontin B , Dartigues J-F , Vellas B , Andrieu S ((2015) ) Antihypertensive drugs, prevention of cognitive decline and dementia: A systematic review of observational studies, randomized controlled trials and meta-analyses, with discussion of potential mechanisms. CNS Drugs 29: , 113–130. |
[40] | Ding J , Davis-Plourde KL , Sedaghat S , Tully PJ , Wang W , Phillips C , Pase MP , Himali JJ , Gwen Windham B , Griswold M , Gottesman R , Mosley TH , White L , Guethnason V , Debette S , Beiser AS , Seshadri S , Ikram MA , Meirelles O , Tzourio C , Launer LJ ((2020) ) Antihypertensive medications and risk for incident dementia and Alzheimer’s disease: A meta-analysis of individual participant data from prospective cohort studies. Lancet Neurol 19: , 61–70. |
[41] | Palmer J , Love S ((2011) ) Endothelin receptor antagonists: Potential in Alzheimer’s disease. Pharmacol Res 63: , 525–531. |
[42] | McGrath JC , Drummond GB , McLachlan EM , Kilkenny C , Wainwright CL ((2010) ) Guidelines for reporting experiments involving animals: The ARRIVE guidelines. Br J Pharmacol 160: , 1573–1576. |
[43] | Waki H , Kasparov S , Katahira K , Shimizu T , Murphy D , Paton JF ((2003) ) Dynamic exercise attenuates spontaneous baroreceptor reflex sensitivity in conscious rats. Exp Physiol 88: , 517–526. |
[44] | Morris CD , Rose A , Curwen J , Hughes AM , Wilson DJ , Webb DJ ((2005) ) Specific inhibition of the endothelin A receptor with ZD4054: Clinical and pre-clinical evidence. Br J Cancer 92: , 2148–2152. |
[45] | van Beek AH , Lagro J , Olde-Rikkert MG , Zhang R , Claassen JA ((2012) ) Oscillations in cerebral blood flow and cortical oxygenation in Alzheimer’s disease. Neurobiol Aging 33: , 428 e421–431. |
[46] | Langager AM , Hammerberg BE , Rotella DL , Stauss HM ((2007) ) Very low-frequency blood pressure variability depends on voltage-gated L-type Ca2+ channels in conscious rats. Am J Physiol Heart Circ Physiol 292: , H1321–1327. |
[47] | Thomas T , Miners S , Love S ((2015) ) Post-mortem assessment of hypoperfusion of cerebral cortex in Alzheimer’s disease and vascular dementia. Brain 138: , 1059–1069. |
[48] | Miners JS , Palmer JC , Love S ((2016) ) Pathophysiology of hypoperfusion of the precuneus in early Alzheimer’s disease. Brain Pathol 26: , 533–541. |
[49] | Li H , Chen SJ , Chen YF , Meng QC , Durand J , Oparil S , Elton TS ((1994) ) Enhanced endothelin-1 and endothelin receptor gene expression in chronic hypoxia. J Appl Physiol 77: , 1451–1459. |
[50] | Somaini G , Stamm A , Müller-Mottet S , Hasler E , Keusch S , Hildenbrand FF , Furian M , Speich R , Bloch KE , Ulrich S ((2015) ) Disease-targeted treatment improves cognitive function in patients with precapillary pulmonary hypertension. Respiration 90: , 376–383. |
[51] | Pernow J , Shemyakin A , Böhm F ((2012) ) New perspectives on endothelin-1 in atherosclerosis and diabetes mellitus. Life Sci 91: , 507–516. |
[52] | Iglarz M , Steiner P , Wanner D , Rey M , Hess P , Clozel M ((2015) ) Vascular effects of endothelin receptor antagonists depends on their selectivity for ETA versus ETB receptors and on the functionality of endothelial ETB receptors. J Cardiovasc Pharmacol 66: , 332–337. |
[53] | Singh G , Sharma B , Jaggi AS , Singh N ((2014) ) Efficacy of bosentan, a dual ETA and ETB endothelin receptor antagonist, in experimental diabetes induced vascular endothelial dysfunction and associated dementia in rats. Pharmacol Biochem Behav 124: , 27–35. |
[54] | Vercauteren M , Trensz F , Pasquali A , Cattaneo C , Strasser DS , Hess P , Iglarz M , Clozel M ((2017) ) Endothelin ETA receptor blockade, by activating ETB receptors, increases vascular permeability and induces exaggerated fluid retention. J Pharmacol Exp Ther 361: , 322–333. |
[55] | Briyal S , Nguyen C , Leonard M , Gulati A ((2015) ) Stimulation of endothelin B receptors by IRL-1620 decreases the progression of Alzheimer’s disease. Neuroscience 301: , 1–11. |

