
Effect of Age on the Protein Profile of Healthy Malay Adults and its Association with Cognitive Function Competency
Abstract
Background:
Many studies on biochemical and psychological variables have aimed to elucidate the association between aging and cognitive function. Demographic differences and protein expression have been reported to play a role in determining the cognitive capability of a population.
Objective:
This study aimed to determine the effect of age on the protein profile of Malay individuals and its association with cognitive competency.
Methods:
A total of 160 individuals were recruited and grouped accordingly. Cognitive competency of each subject was assessed with several neuropsychological tests. Plasma samples were collected and analyzed with Q Exactive HF Orbitrap. Proteins were identified and quantitated with MaxQuant and further analyzed with Perseus to determine differentially expressed proteins. PANTHER, Reactome, and STRING were applied for bioinformatics output.
Results:
Our data showed that the Malay individuals are vulnerable to the deterioration of cognitive function with aging, and most of the proteins were differentially expressed in concordance. Several physiological components and pathways were shown to be involved, giving a hint of a promising interpretation on the induction of aging toward the state of the Malays’ cognitive function. Nevertheless, some proteins have shown a considerable interaction with the generated protein network, which provides a direction of focus for further investigation.
Conclusion:
This study demonstrated notable changes in the expression of several proteins as age increased. These changes provide a promising platform for understanding the biochemical factors affecting cognitive function in the Malay population. The exhibited network of protein-protein interaction suggests the possibility of implementing regulatory intervention in ameliorating Malay cognitive function.
INTRODUCTION
Individual aging has long been associated with a decline in cognitive function. A gradual increase in the number of older individuals has been observed in developing or developed countries [1]. The shift in the demographic distribution toward older age has led to an increased incidence of cognitive deterioration [2]. Consequently, there is an increased risk for dementia, and it is predicted that approximately 131.5 million individuals will experience this pathological condition by the year 2050 [3]. It has been reported that the prevalence of dementia has increased exponentially with age [3, 4]. The disease involves deterioration of cognitive capabilities that generally affect an individual’s quality of life and everyday activities [5, 6]. The inability to manage personal routines affects not only the individual but also others around them due to the changes in their emotional state, daily activities, well-being, and general quality of life [7, 8].
The presence of communities that have aged successfully (generally termed as ‘successful aging’) demonstrates that there is a potential alternative for reducing the consequences of aging on cognitive function. Successful aging includes a vast spectrum of individual physiological capacity (for a review, see Song et al. [9]). In the context of cognition, successful aging refers to the coherence of cognitive functionality without age as a significant contributor to pathological outcomes (for a review, see Rowe and Kahn [10] and Fiocco and Yaffe [11]). This perspective is essential considering the demographic distributions of many populations are trending toward the development of “aging” countries [12]. An older population that possesses unimpaired cognitive capability is of obvious benefit not only for the social growth of a population [13] but also for stimulating the economic growth of a nation [14]. Given the favorable prospects rooting from successful aging, fundamental knowledge in understanding aging itself is vital to establish a country’s developmental framework.
For decades, aging-related studies have been conducted to elucidate the mechanisms involved in the development of aging symptoms, primarily concerning the deterioration of cognitive function [2, 15]. Changes in protein expression are among the factors studied that might contribute to the effects of aging on cognitive function [16, 17]. However, population differences may exist, and studies on the effect of age on cognitive function in the Malay population are still very limited. The present study aimed to identify the correlation of cognitive function with differential protein expression in Malays with advanced age. The findings of this study will not only provide baseline data for protein expression but also identify pathways to explain mechanisms that can be used as a basis for clinical interventions.
MATERIALS AND METHODS
Subject recruitment
This cross-sectional study was a part of the Towards Useful Aging (TUA) study funded by the Long-term Research Grant Scheme (LRGS) and was approved by the UKM Ethics Committee. Written informed consent was obtained before recruitment of subjects. A total of 1,526 were screened, and 160 healthy subjects from Klang Valley aged 30 years and above were recruited to participate in the study. The Montreal Cognitive Assessment (MoCA) Malay version e-MyMICA (Malaysian Electronic Multiple Intelligence Checklist for Adults) Version 2 (2008 test) [18] was conducted to assess the subjects’ cognitive impairment. A total of 146 participants were included after passing our inclusion and exclusion criteria. Inclusion criteria were the lack of any known physical or mental illness, Malay race, and no more than 15 years of schooling. Exclusion criteria were having a smoking habit, being on medication or supplements, having more than 15 years of schooling, being diagnosed with a psychiatric disorder or an untreatable chronic disease such as cancer, diabetes, kidney failure, or coronary heart disease, and having a history of neurological disease affecting cognitive function. Participants’ medical records were not accessed, and their healthiness was based on self-reported screening responses and the MoCA test. Subjects were divided into groups based on age range; group 30 = 30–39 years old, group 40 = 40–49 years old, group 50 = 50–59 years old, and group 60 and above≥60 years old. Blood was collected and analyzed accordingly.
Neuropsychological testing
Montreal Cognitive Assessment (MoCA)
The test was categorized into several distinct domains: visuospatial/executive, identification, memory, focus, language, abstract thinking, delayed memory, and orientation. The visuospatial/executive domain contained elements related to strategy and the ability to interpret specific objects. In the identification domain, questions were intended to assess the ability to name objects. For the memory domain, a list of words was presented, and subjects were asked to recall each word. Subjects were required to repeat the same list of words in the delayed memory domain. In the focus domain, there were two sequences of numbers presented, an ordered sequence and a reverse-order sequence, and subjects were asked to recall each number mentioned. Furthermore, subjects were presented with a list of words, and a specific word was designated to have a particular meaning. Subjects were required to respond if they came across the word. The ability to consistently focus was also being assessed with several questions. In the language domain, the ability to repeat the presented sentences and the ability to name an object based on the first letter within a time limit were assessed. For the abstract thinking domain, the ability to find similarities between designated objects was evaluated. For the orientation domain, subjects were asked about the current situation such as the time and date. In addition, the MoCA was also applied as a tool to assess cognitive impairment to ensure that the subjects were cognitively competent.
Rey Auditory Verbal Learning Test (RAVLT)
A 15 noun-word list was read to the subjects with a gap of one second between words. Subjects were requested to recall as many words as possible after the lists had been presented; the order of lists was not taken into account. Each correctly repeated word was summed into a total score for each trial. The procedure was repeated five times (Trials I-V). After list A was presented, an interference list (list B) was introduced consisting of 15 other noun-words, and subjects were asked to recall as many words as possible. After a 20–min delay period, each subject was again required to recall the words in list A (Trial VI). The total score for Trial VI was recorded for each word repeated correctly.
Forward Digit Span (FDS)
Subjects listened to a string of digits and repeated them in forward order verbally. The first sequence consisted of three digits. An additional digit was added until a maximum span of nine digits was achieved if subjects were able to express each digit correctly. The subjects had two trials for each span. If subjects repeated wrong digits in two of the trials, the test was halted. Scoring was based on the maximum digits repeated without error in one of the two trials.
Backward Digit Span (BDS)
Execution of this test was similar to the FDS. Subjects repeated the span in reverse order with the last digit in the span repeated first. The first span included two digits, and the last one was eight digits. The test was stopped if an error was made in two consecutive trials. Like the FDS, each subject’s score was the maximum digits repeated without error in one of the two trials.
Digit Symbol
Subjects were required to redraw symbols that were matched with a particular number within 120 min. A list of numbers was shown in parallel to the assigned symbols for reference during the task. Subjects were allowed to practice drawing the symbols before beginning the actual test. Scoring was based on the total number of symbols drawn regardless of sequence.
Visual Reproduction (VR)
There were two parts of this task, VRI and VRII. In VRI, four different cards were presented to the subjects. Each card was shown within five seconds, and subjects were asked to redraw the shape on each card. In VRII, subjects were given a glimpse of the drawn shapes and required to memorize them. The subjects were then asked to redraw the shapes without the presence of any visual stimuli.
Sample preparation
The collected plasma samples were pooled into several different tubes based on the designated age groups. Each tube contained 20 plasma samples pooled from different individuals to further enhance peptide signals in the LC-MS/MS run as performed in previous research [9–19]. Combining the samples increased the likelihood of detecting low abundant proteins [20], thus allowing for a better interpretation of the overall output. Population variance was largely unaffected by pooling the samples. Diz et al. [21] showed that variance between individual samples and pooled samples did not differ much, as the reduction of variance in the pooled sample was due to an averaging effect. Hence, sample pooling does not necessarily hinder the interpretation of a population, in this case at the protein level. Moreover, two replicates of each pooled sample were made in order to avoid statistical overestimation. Each tube was then subjected to albumin and immunoglobulin gamma (IgG) depletion. Elimination of these proteins was carried out according to the procedure provided in the manual booklet (Albumin IgG Depletion Spintrap™, GE Healthcare, USA). In-gel separation was applied to the acquired depleted samples. The gel was stained with SimplyBlue™ SafeStain (Thermo Fischer Scientific, Germany) and washed thoroughly to remove excess stain. The gel was then kept in distilled water and shaken constantly overnight.
In-gel tryptic digestion
The gel was excised in 1 cm strips. The gel plugs were transferred into 100 uL of 50% ACN (Thermo Fischer Scientific, Germany) in 50 mM ammonium bicarbonate (Sigma-Aldrich, USA) and shaken thoroughly for 15 min. The solution was removed, and the process was repeated until no visible stain was observed. A total of 300μL of 10 mM DTT (Sigma-Aldrich, USA) in 100 mM ammonium bicarbonate (Sigma-Aldrich, USA) was pipetted into the tube containing the gel plugs and incubated at 60°C for 30 min. The mixture was left at room temperature, and the solution was discarded from the tube. A total of 300μL of 55 mM iodoacetamide (Wako, Japan) in 100 mM ammonium bicarbonate (Sigma-Aldrich, USA) was added to the gel plugs and incubated in the dark for about 20 min. The solution was then removed, and the gel plugs were washed three times with 500μL 50% ACN (Thermo Fischer Scientific, Germany) in 100 mM of ammonium bicarbonate (Sigma-Aldrich, USA). The washing process was performed with vigorous shaking for 20 min each turn, and the washing solution was removed in each repetition. The gels were subsequently incubated in 100μL 100% ACN (Sigma-Aldrich, USA) for 15 min, and the solution was kept inside the tube. The mixture (gel plugs with added solution) was centrifuged in a speed vacuum for 15 min or until no solution was visible inside the tube. The gel plugs were then incubated with 50μL 6 ng/μL trypsin (Promega, USA) in 50 mM ammonium bicarbonate at 37°C and was kept overnight. Later, 100μL 100% ACN (Sigma-Aldrich, USA) was added to the tubes and shaken for 15 min. The solution was subsequently transferred into a new tube. The collected solution was centrifuged for 2.5 h or until no excess solution was visible. Then 15μL 0.1% formic acid (Thermo Fischer Scientific, Germany) was pipetted, and the samples were prepared for further analysis.
Liquid chromatography and MS/MS analysis
The crude sample underwent chromatographic separation in the UltiMate™ 3000 RSLCnano System (Thermo Scientific, Germany). Following separation, determination of the peptide spectrum was carried out using the Thermo Scientific Q Exactive HF Orbitrap mass spectrometer (Thermo Scientific, Germany). Before injection into the mass spectrometer, samples were ionized by separation column-coupled electrospray ionization (ESI) and set at a temperature of 50°C and 250°C, respectively. The spray voltage was fixed at 2 kV with the spray current at 2μA. Gradient elution was used for transporting the solution into the mass spectrometer with a mobile phase consisting of 0.1% formic acid in distilled water (panel A) and 0.1% formic acid with 0.1% TFA (Thermo Fischer Scientific, Germany) in ACN (panel B). Two pumps with distinct rates of flow were adjusted for mobile phase transportation. Gradient elution was set as follows: 1) 5–60% panel B within 108 min, 2) 5 min flow to 95% panel B, 3) 95% of panel B flow within 10 min, and 4) the flow was changed back to 2% panel B within 2 min. Flow rate was fixed at 30μL/min within the total sample run. Samples were injected at a specific flow rate as follows: 1) 30μL/min of the flow at the beginning of the first 3 min, 2) 5μL/min of the flow at the 4th min until the 123rd min, and 3) 30μL/min of the flow in the next 125 min. Injection was done automatically with a microliter pick-up, and 5μL of flush volume was set to carry the samples into the spectrometer. The total volume (automatically injected) was 11μL with 6μL from the samples. For mass spectrometer settings, data-dependent analysis (DDA) was used as a method for spectrum identification. Several approaches were applied for DDA settings: general setting, full scan of the mass spectrometry, data-dependent setting, and MS/MS data-dependent induction. For the general setting, a molecule with positive charge was used for peptide sequence identification. +2 charges were set as the default for m/z value (if the charge of the spectrum was unable to be specified). In the full scan setting, the range of scan encompassed 350 to 1,800 m/z for the detected spectra while the resolution of determination was 120,000. Automated gain control was set at 3e6, and maximum duration for the ion collection in each full scan was 100 ms. For the data-dependent induction setting, the time range to introduce data-dependent execution was set at 2 to 15 s for each scan. Automatic gain control was set to a minimum rate of 5e3 to induce the related activity, and the intensity threshold was set to at 7.7e4.
Protein identification, quantification, annotation, and interaction analysis
The software used for spectra analysis was MaxQuant version 1.5.3.30, which uses a target-decoy search strategy [22] for peptide sequence matching. The database for spectra identification was from the Homo sapiens sequence (taxonomic ID: 9606, UniProtKB) and a similar database for the subjected inverse sequence. Specific modes of digestion (in silico) were imposed, and trypsin was subjected to the digestive element. Missed cleavage for incomplete/unspecific digestion of the enzyme was set at two sites for protein sequence purposes. Methionine oxidation was subjected to constant modification of the amino acid, and only five modification sites were set as thresholds for each identified peptide. Alkylation of the thiol group was subjected to constant modification. In order to reduce insignificant identified peptides as protein structures, the length of the peptide was set to a minimum of seven peptides, and maximum weight was prescribed as 4,600. Proteins were then quantified using the label-free quantification (LFQ) approach. Raw data acquired from MaxQuant were analyzed to determine protein expression. The Homo sapiens sequence (taxonomic ID: 9606, UniProtKB) was used for protein determination purposes. ANOVA and Fisher’s exact test were conducted to determine differences in protein expression and its grouping, respectively. Different platforms were used for ontology and pathway analysis. PANTHER (version 12) [23] was used for ontology interpretation while Reactome (version 64) [24] was applied for analysis. For protein-protein interaction analysis, Search Tool for the Retrieval of Interacting Genes/Proteins (STRING version 10.5) [25] was used.
Statistical analysis
Data were analyzed using IBM SPSS v16 (IBM Inc, USA). Normally distributed data were presented as Mean±SEM (standard error of the mean) while non-normally distributed data were presented as Median±IQR (interquartile range). One-way ANOVA and Kruskal-Wallis H test were conducted to identify differences among effects of the age groups on dependent variables. Post-hoc analysis and Mann-Whitney U test were further implemented to obtain within-groups differences after respective comparison tests between age groups were done. Mixed factorial repeated-measure ANOVA was used for the RAVLT test data analysis to obtain a trial-to-trial progression and further analyzed with pairwise comparisons to identify age group differences. Statistical significance was set to alpha <0.05, and corrections were conducted on the p-value based on particular statistical considerations.
RESULTS
Demographic status and blood profile of malay individuals
Significant differences in education were shown between Group 50 and Group 30 and between Group≥60 and Group 30 (p < 0.05; see Table 1). Several measures of peripheral blood status were significantly different across age groups (see Table 2). Red blood cell (RBC) levels in Group 40, Group 50, and Group≥60 were significantly lower compared to Group 30 (p < 0.05). For MCV and MCH, Group 30 showed a significantly lower volume compared to the other age groups. Several measures of kidney function were significantly different across age groups. Group≥60 showed a significantly higher concentrations of sodium, potassium, and urea compared to other age groups (p < 0.05) in addition to increased eGFR. In the liver function test, decreased albumin levels were observed in Group 50 and Group≥60 compared to other age groups (p < 0.05). ALP levels, however, were increased in Group≥60 compared to other age groups (p < 0.05). Group 50 and Group≥60 also showed a significantly higher LDL cholesterol level compared to Group 30 (p < 0.05).
Table 1
Demographic profile of the Malaysian population
| Variable | Group 30 N = 40 | Group 40 N = 40 | Group 50 N = 40 | Group≥60 N = 40 |
| Sex | ||||
| Male | 21 | 17 | 25 | 20 |
| Female | 19 | 23 | 15 | 20 |
| Year of Education | 13.20 (0.22) | 12.42 (0.34) | 11.20 (0.33)a | 10.80 (0.30)a |
asignificant different (p < 0.05) compared to Group 30.
Table 2
Blood profile of the Malay population
| Analyte | Group 30 (N = 40) | Group 40 (N = 40) | Group 50 (N = 40) | Group≥60 (N = 40) |
| Hemoglobin (g/L) | 133.93 (2.85) | 135.00 (2.02) | 128.20 (2.37) | 126.38 (2.53) |
| RBC (1012/L) | 5.08 (0.09) | 4.84 (0.07)a | 4.69 (0.09)a | 4.57 (0.10)a |
| HCT (L/L) | 0.42 (0.01) | 0.42 (0.01) | 0.40 (0.01) | 0.42 (0.01) |
| MCV (fL) | 84.46 (5.63) | 86.45 (5.89)a | 85.88 (7.42)a | 88.98 (10.01)a |
| MCH ([pg]) | 26.37 (0.32) | 27.96 (0.28)a | 27.43 (0.38) | 27.76 (0.29)a |
| MCHC (g/L) | 315.93 (15.44) | 324.38 (14.63) | 323.17 (19.92) | 306.75 (25.04) |
| RDW-CV ([%]) | 12.98 (0.18) | 12.88 (0.22) | 13.12 (0.23) | 13.03 (0.18) |
| WBC (1010/L) | 6.85 (2.23) | 7.55 (2.90) | 6.90 (2.70) | 6.45 (1.50) |
| Neutrophil (1010/L) | 54.00 (9.25) | 56.00 (14.00) | 51.00 (16.25) | 45.00 (21.75) |
| Lymphocyte (1010/L) | 34.88 (0.98) | 33.88 (1.39) | 35.50 (1.27) | 30.68 (1.64) |
| Monocyte (1010/L) | 6.90 (0.27) | 6.33 (0.25) | 6.33 (0.35) | 6.30 (0.48) |
| Eosinophil (1010/L) | 2.65 (0.26) | 2.95 (0.24) | 2.98 (0.26) | 2.75 (0.25) |
| Basophil (1010/L) | 1.48 (0.13) | 1.20 (0.07) | 1.33 (0.08) | 1.58 (0.18) |
| Platelet (1010/L) | 296.00 (89.75) | 278.50 (94.00) | 268.50 (79.75) | 276.00 (74.25) |
| Kidney Function | ||||
| Sodium | 141.00 (2.00) | 141.00 (3.00) | 142.00 (3.00) | 143.00 (3.75)a,b,c |
| Potassium | 4.02 (0.07) | 3.89 (0.07) | 4.03 (0.06) | 4.30 (0.10)a,b |
| Chloride | 102.00 (4.00) | 102.00 (3.75) | 102.00 (3.00) | 102.00 (3.00) |
| Urea | 3.50 (0.87) | 3.15 (1.30) | 3.85 (1.43)b | 4.30 (1.35)a,b |
| Uric acid | 316.50 (121.50) | 271.50 (136.50) | 286.50 (98.50) | 308.00 (114.75) |
| Creatine | 70.90 (2.59) | 66.03 (2.51) | 69.84 (3.63) | 69.30 (2.83) |
| eGFR | 95.70 (2.88) | 97.43 (3.07) | 76.50 (3.53)a,b | 82.78 (3.05)a,b |
| Mineral and bone status | ||||
| Calcium | 2.37 (0.01) | 2.36 (0.01) | 2.36 (0.03) | 2.35 (0.01) |
| Phosphate | 1.13 (0.04) | 1.12 (0.04) | 1.14 (0.03) | 1.18 (0.02) |
| Liver function | ||||
| Albumin | 46.90 (0.44) | 46.63 (0.44) | 44.38 (0.70)a,b | 44.55 (0.41)a,b |
| Globulin | 30.50 (6.00) | 31.00 (5.00) | 32.00 (4.75) | 33.00 (13.00) |
| Bilirubin | 8.98 (0.74) | 11.15 (0.82) | 10.80 (0.78) | 10.48 (0.77) |
| ALP | 73.65 (2.64) | 65.85 (3.00) | 65.33 (3.12) | 77.45 (2.85)b,c |
| GGT | 21.00 (19.50) | 18.50 (20.75) | 16.00 (22.75) | 24.00 (19.00) |
| AST | 20.98 (1.00) | 21.53 (1.31) | 18.72 (1.10) | 23.10 (1.19) |
| ALT | 18.00 (24.25) | 16.00 (15.75) | 14.00 (8.75) | 17.00 (11.50) |
| Lipid status | ||||
| Triglyceride | 0.97 (1.13) | 1.17 (0.89) | 1.17 (0.70) | 1.14 (1.29) |
| HDL cholesterol | 1.49 (0.29) | 1.45 (0.56) | 1.43 (0.43) | 1.38 (0.41) |
| LDL cholesterol | 3.17 (0.12) | 2.94 (0.10)a | 3.53 (0.14)a | 3.58 (0.15)a |
| Glucose level | 4.50 (0.85) | 4.55 (0.70) | 4.60 (0.60) | 4.80 (0.78) |
Value for hemoglobin, RBC, HCT, MCH, RDW-CV, lymphocyte, monocyte and basophil, potassium, chloride eGFR, calcium, phosphate, albumin, bilirubin, alkaline phosphatase (ALP), aspartate transferase (AST) and LDL cholesterol were depicted as min (SEM) while MCV, MCHC, WBC, neutrophil, platelet, sodium, chloride, urea, uric acid, globulin, gamma-glutamyl transferase (GGT), alanine transaminase (ALT) were shown as median (IQR). asignificant different (p < 0.05) compared to Group 30. bsignificant different (p < 0.05) compared to Group 40. csignificant different (p < 0.05) compared to Group 50.
Advanced age correlates with cognitive decline
Although the MoCA test was initially performed to eliminate mild cognitive impairment (MCI) subjects from the study, its outcome was included as an indicator for subjects’ competency in global cognition. Group 50 and Group≥60 had significantly lower MoCA scores compared to Group 30 and Group 40 (p < 0.05; see Table 3). In the RAVLT test, there are two interpretations involving learning capability and short-term memory capacity. The ability to learn was significantly improved in all age groups from trial to trial (Table 4), but Group 50 and Group≥60 showed a significantly lower learning capacity compared to Group 30 and Group 40 (p < 0.05; see Table 3). As for short-term memory, Group 50 and Group≥60 possessed a significantly lower ability to retain information over short timespans compared to Group 30 and Group 40 (p < 0.05; see Table 3). Additionally, information organization was evaluated with the digit span test. There was no significant difference in FDS across age groups while Group≥60 showed a significantly lower BDS compared to Group 30 (p < 0.05). Processing speed differences across the groups were assessed with the digit symbol test, and we found slower processing in Group 40, Group 50, and Group≥60 compared to Group 30 (p < 0.05). The processing speed of Group≥60 was also significantly slower compared to Group 40 and Group 50 (p < 0.05). Immediate and delayed visual memory were determined in parallel (VRI and VRII). Results showed that both VRI and VRII were lower in Group 50 and Group≥60 compared to Group 30 and Group 40 (p < 0.05).
Table 3
Cognitive competency across age groups. Differences in the RAVLT test scores are depicted based on acquired RM-ANOVA values. Specific changes parallel to the transition of trials in RAVLT test were further analyzed in a separate table
| Neuropsychological test | MoCA | RAVLT | Immediate Recall | Digit Span | Digit Symbol | Visual Reproduction | ||||||
| Trial I | Trial II | Trial III | Trial IV | Trial V | FDS | BDS | VRI | VRII | ||||
| Age group | ||||||||||||
| Group 30 | 27.60 (0.21) | 6.98 (0.19) | 9.40 (0.34) | 11.22 (0.41) | 12.40 (0.32) | 13.15 (0.34) | 12.00 (0.37) | 10.42 (0.44) | 7.60 (0.36) | 79.28 (2.43) | 38.25 (0.38) | 36.68 (0.64) |
| Group 40 | 28.12 (0.26) | 5.45 (0.25)a | 8.80 (0.23) | 10.38 (0.33) | 11.95 (0.29) | 12.95 (0.28) | 11.75 (0.35) | 10.58 (0.33) | 7.08 (0.26) | 68.18 (2.14)a, | 38.12 (0.51) | 34.75 (0.96) |
| Group 50 | 26.62 (0.24)a,b | 5.15 (0.22)a | 8.28 (0.25)a,d | 9.38 (0.29)a | 10.62 (0.36)a,b | 10.88 (0.53)a,b | 9.20 (0.54)a,b | 10.00 (0.31) | 6.60 (0.42) | 68.88 (2.30)a, | 32.85 (0.75)a,b | 31.92 (0.81)a,b |
| Group≥60 | 25.72 (0.16)a,b | 4.88 (0.14)a | 7.08 (0.33)a,b,c | 9.12 (0.30)a,b | 9.72 (0.36)a,b | 10.35 (0.33)a,b | 7.80 (0.69)a,b | 10.68 (0.20) | 6.20 (0.34)a | 53.50 (2.53)a,b,c | 28.18 (0.59)a,b | 26.30 (1.05)a,b |
| F statistic (df) | 23.25 (3)* | 3.03 (9.97)# | 16.10 (3)* | 0.80 (3)* | 2.98 (3)* | 20.25 (3)* | 70.63 (3)* | 49.17 (3)* | ||||
| p value | <0.01* | <0.01# | <0.01 | 0.49* | 0.03* | <0.01* | <0.01 | <0.01 | ||||
Value was shown as mean (SEM). *One-way ANOVA. Post hoc analysis was conducted to determine between-subject differences. #Repeated measure ANOVA. ρ value was corrected using Bonferroni procedure for multiple comparison purpose Reported p value was based on two-tailed test. asignificant different (p < 0.05) compared to Group 30. bsignificant different (p < 0.05) compared to Group 40. csignificant different (p < 0.05) compared to Group 50. dsignificant different (p < 0.05) compared to Group≥60.
Table 4
Subsequent analysis of RAVLT test scores in reference to the transition of the trials
| Age Group | Trial | Mean Difference (95% CI) (I-J) | ρ-value | |
| (I) | (J) | |||
| Group 30 | Trial I | Trial II | –2.43 (–3.00, –1.85)* | <0.001 |
| Trial III | –4.25 (–4.93, –3.57)* | <0.001 | ||
| Trial IV | –5.43 (–6.12, –4.73)* | <0.001 | ||
| Trial V | –6.18 (–6.90, –5.46)* | <0.001 | ||
| Trial II | Trial I | 2.43 (1.85, 3.00)* | <0.001 | |
| Trial III | –1.83 (–2.38, –1.27)* | <0.001 | ||
| Trial IV | –3.00 (–3.59, –2.41)* | <0.001 | ||
| Trial V | –3.75 (–4.41, –3.09)* | <0.001 | ||
| Trial III | Trial I | 4.25 (3.57, 4.93)* | <0.001 | |
| Trial II | 1.83 (1.27, 2.38)* | <0.001 | ||
| Trial IV | –1.18 (1.57, –0.78)* | <0.001 | ||
| Trial V | –1.93 (–2.59, –1.26)* | <0.001 | ||
| Trial IV | Trial I | 5.43 (4.73, 6.12)* | <0.001 | |
| Trial II | 3.00 (2.41, 3.59)* | <0.001 | ||
| Trial III | 1.18 (0.78, 1.57)* | <0.001 | ||
| Trial V | –0.75 (–1.41, –0.09)* | 0.027 | ||
| Trial V | Trial I | 6.18 (5.46, 6.90)* | <0.001 | |
| Trial II | 3.75 (3.09, 4.41)* | <0.001 | ||
| Trial III | 1.93 (1.26, 2.59)* | <0.001 | ||
| Trial IV | 0.75 (0.09, 1.41)* | 0.027 | ||
| Group 40 | Trial I | Trial II | –3.35 (–3.92, –2.78)* | <0.001 |
| Trial III | –4.93 (–5.61, –4.24)* | <0.001 | ||
| Trial IV | –6.50 (–7.19, –5.81)* | <0.001 | ||
| Trial V | –7.50 (–8.22, –6.78)* | <0.001 | ||
| Trial II | Trial I | 3.35 (2.78, 3.92)* | <0.001 | |
| Trial III | –1.58 (–2.13, –1.02)* | <0.001 | ||
| Trial IV | –3.15 (–3.74, –2.56)* | <0.001 | ||
| Trial V | –4.15 (–4.81, –3.49)* | <0.001 | ||
| Trial III | Trial I | 4.93 (4.24, 5.61)* | <0.001 | |
| Trial II | 1.58 (1.02, 2.13)* | <0.001 | ||
| Trial IV | –1.58 (–1.97, –1.18)* | <0.001 | ||
| Trial V | –2.58 (–3.24, –1.91)* | <0.001 | ||
| Trial IV | Trial I | 6.50 (5.81, 7.19)* | <0.001 | |
| Trial II | 3.15 (2.56, 3.74)* | <0.001 | ||
| Trial III | 1.58 (1.18, 1.97)* | <0.001 | ||
| Trial V | –1.00 (–1.66, –0.34)* | 0.003 | ||
| Trial V | Trial I | 7.50 (6.78, 8.22)* | <0.001 | |
| Trial II | 4.15 (3.49, 4.81)* | <0.001 | ||
| Trial III | 2.58 (1.91, 3.24)* | <0.001 | ||
| Trial IV | 1.00 (0.34, 1.66)* | 0.003 | ||
| Group 50 | Trial I | Trial II | –3.13 (–3.70, –2.55)* | <0.001 |
| Trial III | –4.23 (–4.91, –3.54)* | <0.001 | ||
| Trial IV | –5.48 (–6.17, –4.78)* | <0.001 | ||
| Trial V | –5.73 (–6.45, –5.01)* | <0.001 | ||
| Trial II | Trial I | 3.13 (2.55, 3.70)* | <0.001 | |
| Trial III | –1.10 (–1.66, –0.54)* | <0.001 | ||
| Trial IV | –2.35 (–2.94, –1.76)* | <0.001 | ||
| Trial V | –2.60 (–3.26, –1.94)* | <0.001 | ||
| Trial III | Trial I | 4.23 (3.54, 4.91)* | <0.001 | |
| Trial II | 1.10 (0.54, 1.66)* | <0.001 | ||
| Trial IV | –1.25 (–1.65, –0.85)* | <0.001 | ||
| Trial V | –1.50 (–2.17, –0.83)* | <0.001 | ||
| Trial IV | Trial I | 5.48 (4.78, 6.17)* | <0.001 | |
| Trial II | 2.35 (1.76, 2.94)* | <0.001 | ||
| Trial III | 1.25 (0.85, 1.65)* | <0.001 | ||
| Trial V | –0.25 (–0.91, 0.41) | 0.457 | ||
| Trial V | Trial I | 5.73 (5.01, 6.45)* | <0.001 | |
| Trial II | 2.60 (1.94, 3.26)* | <0.001 | ||
| Trial III | 1.50 (0.83, 2.17)* | <0.001 | ||
| Trial IV | 0.25 (–0.41, 0.91) | 0.457 | ||
| Group≥60 | Trial I | Trial II | –2.20 (–2.77, –1.63)* | <0.001 |
| Trial III | –4.25 (–4.93, –3.57)* | <0.001 | ||
| Trial IV | –4.85 (–5.54, –4.16)* | <0.001 | ||
| Trial V | –5.48 (–6.20, –4.76)* | <0.001 | ||
| Trial II | Trial I | 2.20 (1.63, 2.77)* | <0.001 | |
| Trial III | –2.05 (–2.61, –1.49)* | <0.001 | ||
| Trial IV | –2.65 (–3.24, –2.06)* | <0.001 | ||
| Trial V | –3.28 (–3.93, –2.62)* | <0.001 | ||
| Trial III | Trial I | 4.25 (3.57, 4.93)* | <0.001 | |
| Trial II | 2.05 (1.49, 2.61)* | <0.001 | ||
| Trial IV | –0.60 (–1.00, –0.20)* | 0.003 | ||
| Trial V | –1.23 (–1.89, –0.56)* | <0.001 | ||
| Trial IV | Trial I | 4.85 (4.16, 5.54)* | <0.001 | |
| Trial II | 2.65 (2.06, 3.24)* | <0.001 | ||
| Trial III | 0.60 (0.20, 1.00)* | 0.003 | ||
| Trial V | –0.63 (–1.29, 0.04)* | 0.064 | ||
| Trial V | Trial I | 5.48 (4.76, 6.20)* | <0.001 | |
| Trial II | 3.28 (2.62, 3.93)* | <0.001 | ||
| Trial III | 1.23 (0.56, 1.89)* | <0.001 | ||
| Trial IV | 0.63 (–0.04, 1.29) | 0.064 | ||
Least significant difference was conducted for the adjustment of multiple comparison. *significant difference (ρ< 0.05) compared to the trials in column (I).
Aging induces changes in protein profile
Principal component analysis (PCA) was performed to evaluate the sample represented as data clusters. A notable difference was observed between the age groups in which Group 30 and Group 40 were distinctly separated from Group 50 and Group≥60. Group 30 and Group 40 were strongly grouped, and a similar pattern of clustering was shown for Group 50 and Group≥60 although it was slightly more dispersed (see Fig. 1).
Fig.1
Principal component analysis (PCA) plot for sample characterization in relation to replicates of the age groups.
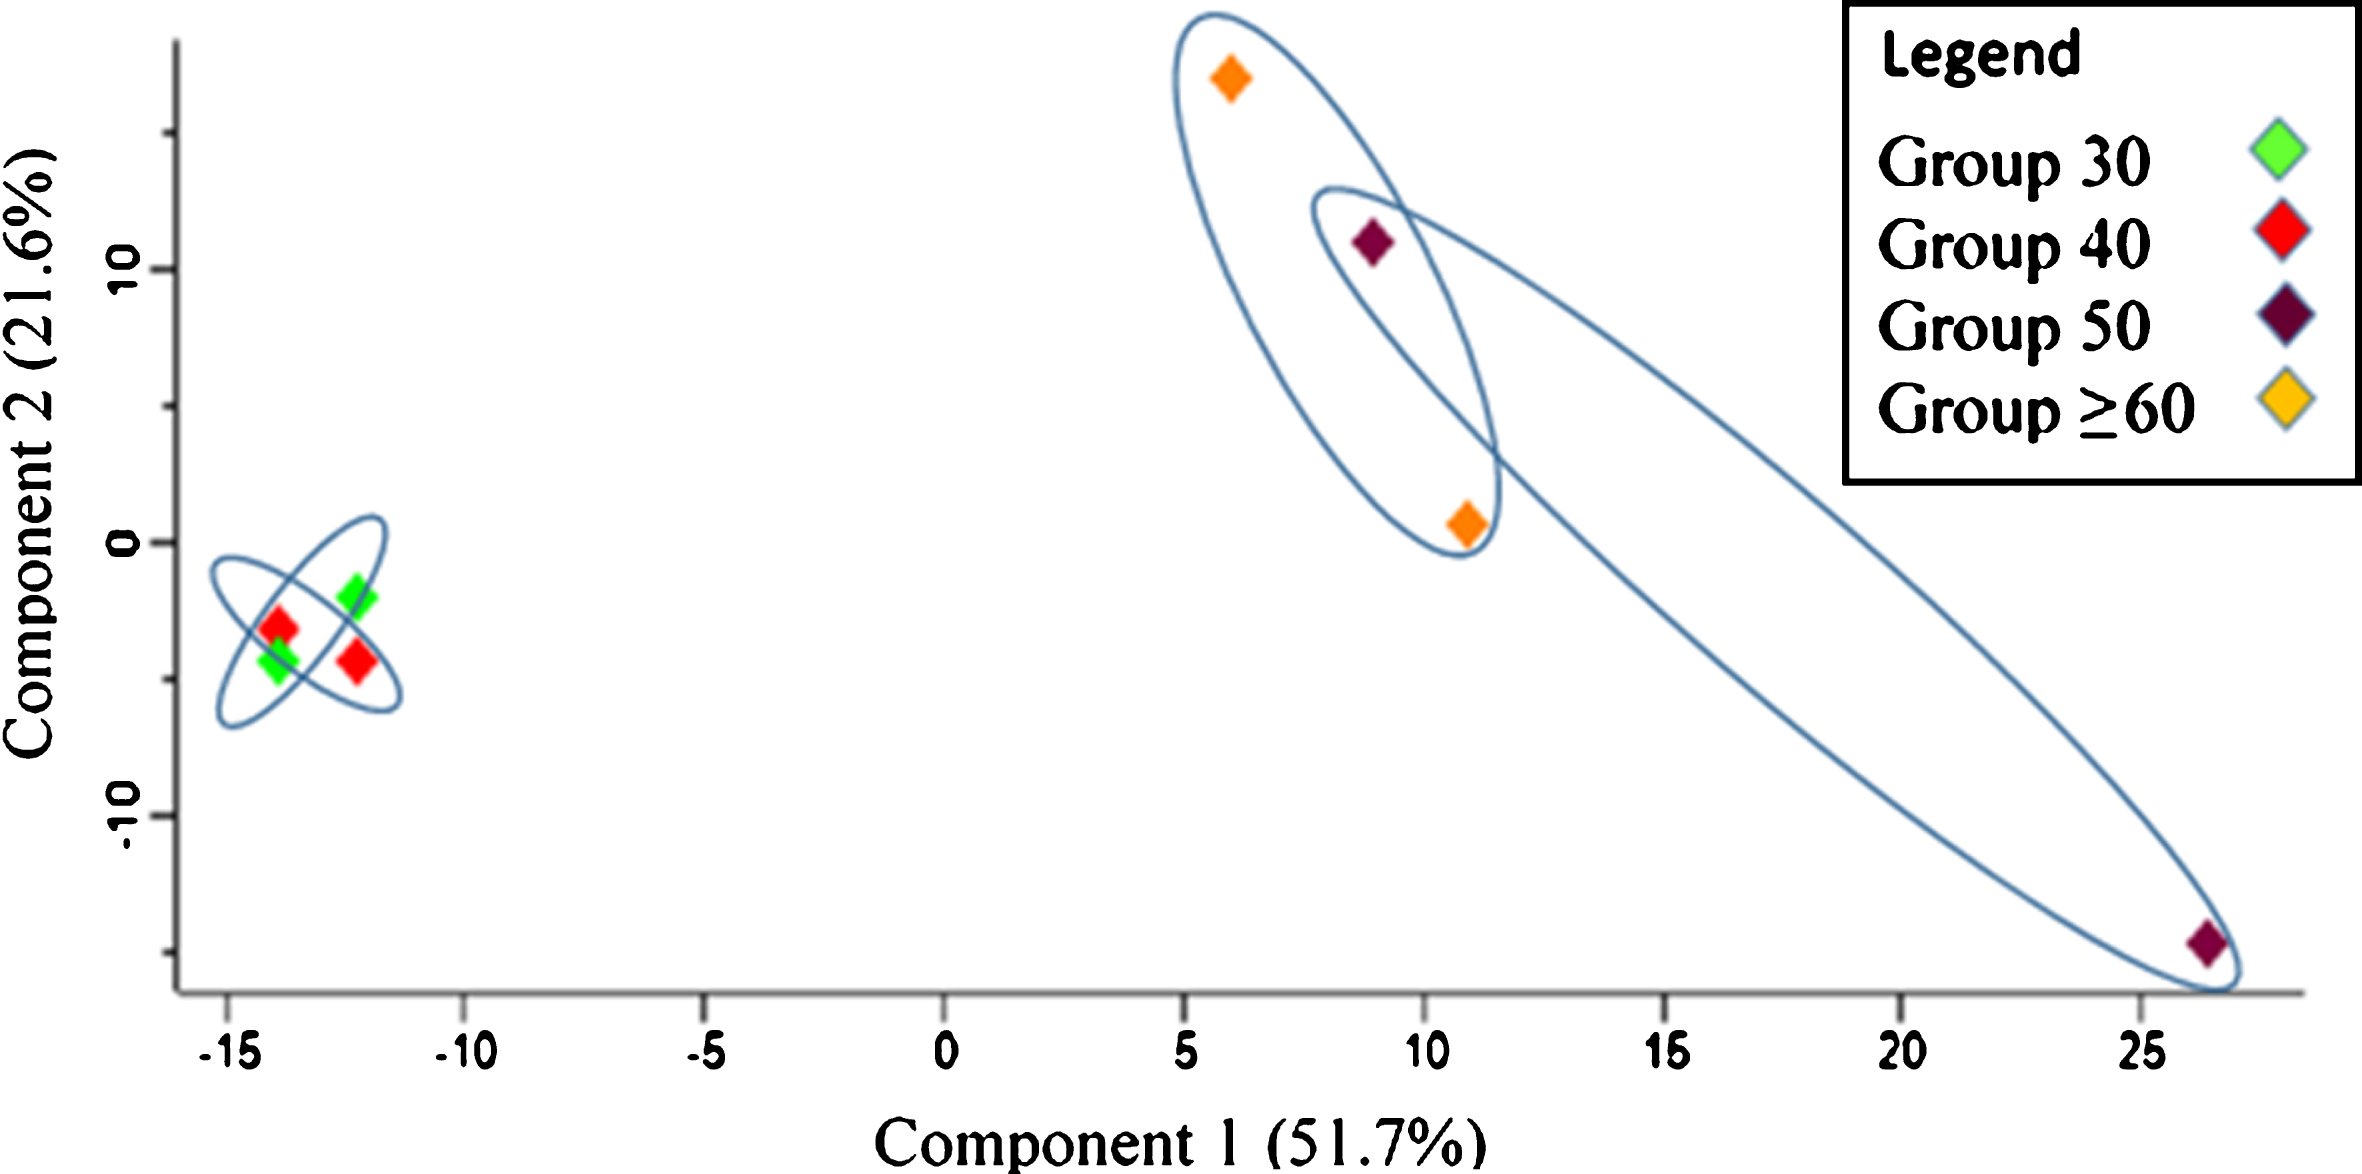
Fig.2
Dispersion of detected proteins were analyzed using Perseus in order to evaluate the linearity of each replicate for each group sample. The correlation coefficient for the relationship is r, and r≥0.7 can be regarded as a strong relationship between variables.
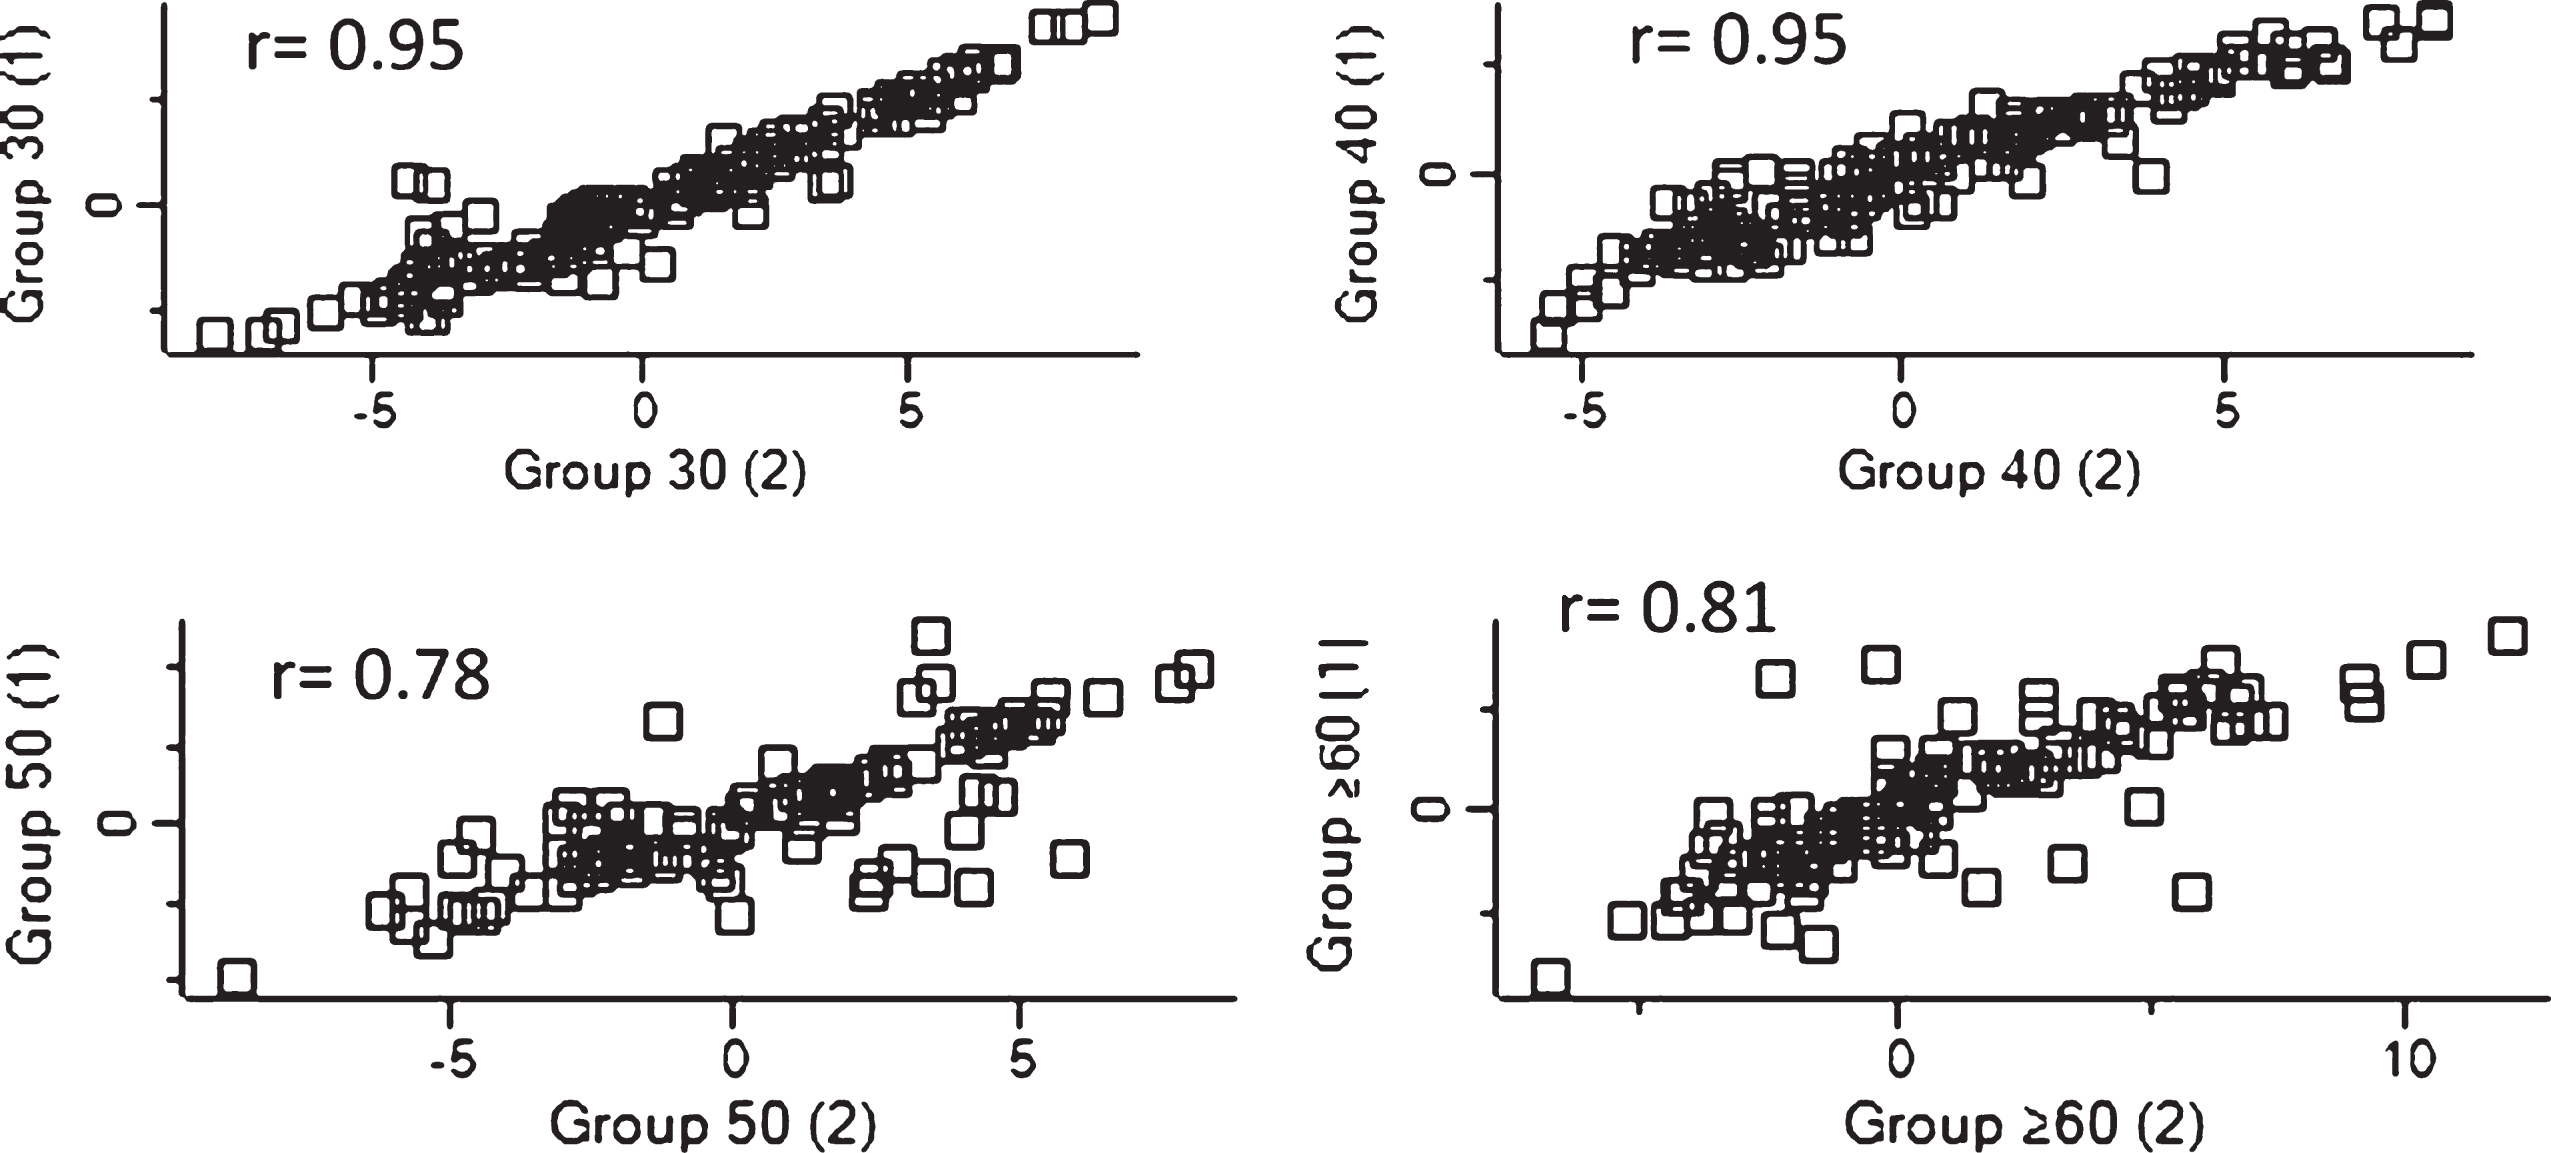
The integrity of replicates from each age group was analyzed. The correlation coefficients (r) were above 0.7, which indicates a strong association between samples (see Fig. 2).
Overall, 226 proteins were observed through sample analysis. Subsequent data filtration involved elimination of contaminants, reverse sequences, and proteins that were identified only by site or determined only by a single unique peptide. Our results revealed an involvement of 113 proteins that were reliable for further analysis. Upon conducting statistical analysis, 24 proteins were found to be significantly different across age groups (see Table 5). A representation of the protein expression and interpretation of the group distribution were further conducted.
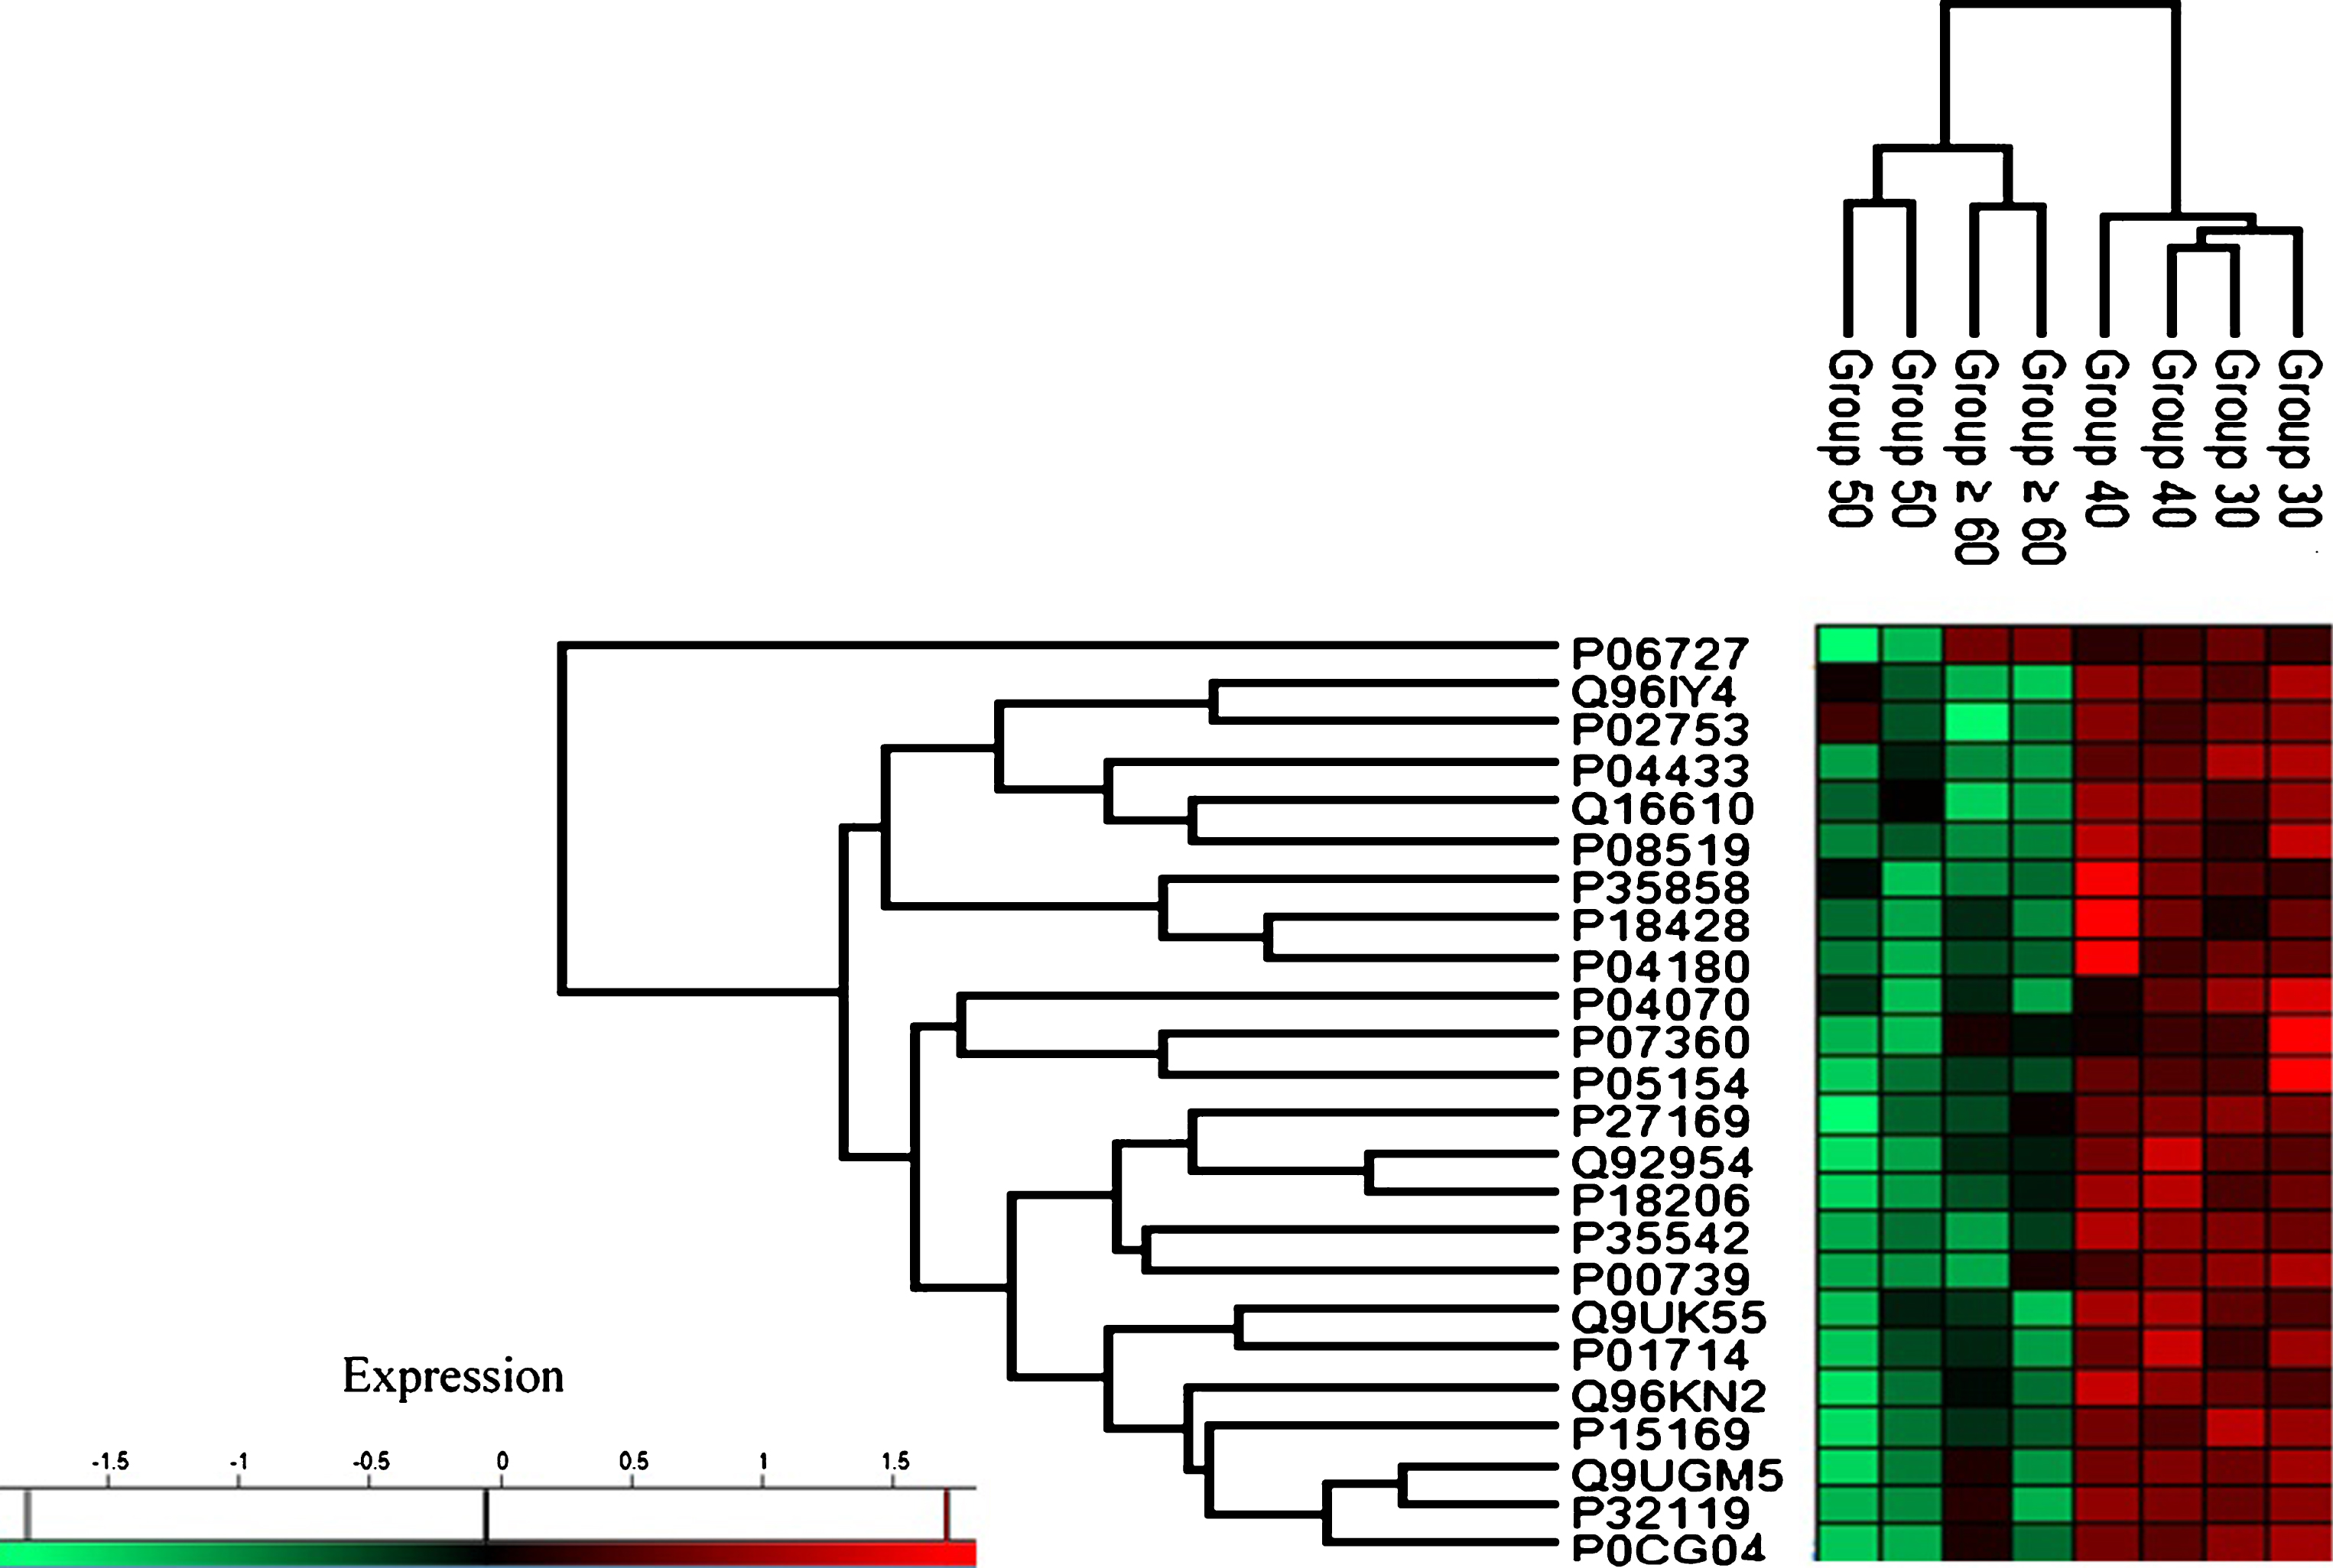
Based on the characterization of protein expression through heat map analysis, two distinct trends of protein regulation across age groups were observed (see Fig. 3). Group 30 and Group 40 exhibited upregulation of protein expression while proteins in Group 50 and Group≥60 were downregulated.
Table 5
Significantly different protein expression across age groups and differential regulation of the expression subjected to mean transformation values (Z-scores)
| Accession Number | Description | Transformed Intensity Value* † | p | Z score* | ||||||
| Group 30 | Group 40 | Group 50 | Group≥60 | Group 30 | Group 40 | Group 50 | Group≥60 | |||
| P0CG04 | Immunoglobulin lambda-1 chain C regions (IGLC1) | 2.93 | 1.29 | –9.22a,b | –3.95a,b | 0.01 | 0.98 | 0.67 | –1.32 | –0.32 |
| P00739 | Haptoglobin-related protein (HPTR) | 1.55 | 0.90 | –1.91a,b | –0.99a | 0.04 | 1.03 | 0.63 | –1.12 | –0.54 |
| P01714 | Immunoglobulin lambda variable 3–19 (IGLV3–19) | –3.11 | –2.78 | –4.76a,b | –4.50b | 0.04 | 0.68 | 1.01 | –0.98 | –0.71 |
| P02753 | Retinol-binding protein 4 (RBP4) | 3.06 | 2.19 | –0.87 | –6.07a,b | 0.03 | 0.85 | 0.64 | –0.11 | –1.38 |
| P04070 | Vitamin K-dependent protein C (PROC) | –4.45 | –5.80 | –7.71a | –7.48a | 0.04 | 1.24 | 0.36 | –0.88 | –0.73 |
| P04180 | Phosphatidylcholine-sterol acyltransferase (LCAT) | –3.19 | –2.50 | –6.44a,b | –5.58b | 0.03 | 0.66 | 1.03 | –1.08 | –0.62 |
| P04433 | Immunoglobulin kappa variable 3–11 (IGKV3–11) | –1.03 | –2.66 | –6.43a,b | –7.49a,b | 0.01 | 1.16 | 0.60 | –0.69 | –1.06 |
| P05154 | Plasma serine protease inhibitor (SERPINA5) | –2.73 | –3.84 | –7.55a,b | –6.15a | 0.04 | 1.07 | 0.56 | –1.13 | –0.49 |
| P06727 | Apolipoprotein A-IV (APOA4) | 4.86 | 4.28 | –1.30a,b,d | 5.59 | 0.00 | 0.51 | 0.31 | –1.57 | 0.75 |
| P07360 | Complement component C8 gamma chain (C8G) | –0.72 | –1.34 | –2.39a,b | –1.49 | 0.04 | 1.10 | 0.21 | –1.30 | –0.01 |
| P08519 | Apolipoprotein(a) (LPA) | –3.35 | –3.11 | –5.07a,b | –5.26a,b | 0.02 | 0.77 | 0.99 | –0.8 | –0.97 |
| P15169 | Carboxypeptidase N catalytic chain (CPN1) | –0.37 | –1.78 | –6.80a,b | –4.94a,b | 0.01 | 1.12 | 0.61 | –1.20 | –0.53 |
| P18206 | Vinculin (VCL) | –4.25 | –3.39 | –7.09a,b | –5.741a,b,c | 0.00 | 0.57 | 1.12 | –1.28 | –0.41 |
| P18428 | Lipopolysaccharide-binding protein (LBP) | –3.65 | –1.99 | –6.32b | –5.68b | 0.03 | 0.39 | 1.23 | –0.97 | –0.64 |
| P27169 | Serum paraoxonase/arylesterase 1 (PON1) | 4.23 | 4.00 | –0.01a,b | 2.06 | 0.03 | 0.85 | 0.73 | –1.32 | –0.26 |
| P32119 | Peroxiredoxin–2 (PRDX2) | –2.75 | –2.56 | –7.09a,b | –5.68 | 0.04 | 0.78 | 0.87 | –1.14 | –0.52 |
| P35542 | Serum amyloid A–4 protein (SAA4) | 0.93 | 2.28 | –7.34a,b | –6.37a,b | 0.01 | 0.76 | 1.05 | –1.01 | –0.80 |
| P35858 | Insulin-like growth factor-binding protein complex acid labile subunit (IGFALS) | –1.06 | –0.14 | –2.39b | –2.52b | 0.04 | 0.41 | 1.21 | –0.75 | –0.86 |
| Q16610 | Extracellular matrix protein 1 (ECM1) | –3.90 | –3.46 | –5.71a,b | –7.31a,b | 0.01 | 0.71 | 0.96 | –0.36 | –1.31 |
| Q92954 | Proteoglycan 4 (PRG4) | –3.77 | –2.73 | –7.90a,b | –5.54a,b,c | 0.00 | 0.57 | 1.05 | –1.36 | –0.26 |
| Q961Y4 | Carboxypeptidase B2 (CPB2) | –3.52 | –3.42 | –5.71a,b | –7.80a,b | 0.01 | 0.80 | 0.85 | –0.30 | –1.34 |
| Q96KN2 | Beta-Ala-His dipeptidase (CNDP1) | –4.53 | –4.02 | –6.21a,b | –5.50b | 0.01 | 0.56 | 1.11 | –1.20 | –0.46 |
| Q9UGM5 | Fetuin-B (FETUB) | –0.54 | –0.84 | –6.68a,b | –4.47 | 0.03 | 0.88 | 0.78 | –1.20 | –0.45 |
| Q9UK55 | Protein Z-dependent protease inhibitor (SERPINA10) | –3.88 | –2.57 | –6.99b | –7.16b | 0.04 | 0.55 | 1.12 | –0.80 | –0.87 |
*Displayed value was based on the reading of sample replicates. †Demonstrated intensity value was subjected to log2 transformation and width adjustment for data normalization. @Post hoc analysis was conducted to determine disparity among the groups. Reported p value was based on two-tailed test. asignificant different (p < 0.05) compared to Group 30. significant different (p < 0.05) compared to Group 40. csignificant different (p < 0.05) compared to Group 50.
Fig.3
Heat map plot (generated with Perseus) of the indicated age groups’ protein expression. The intensity value depicts the direction of protein expression as upregulated or downregulated.
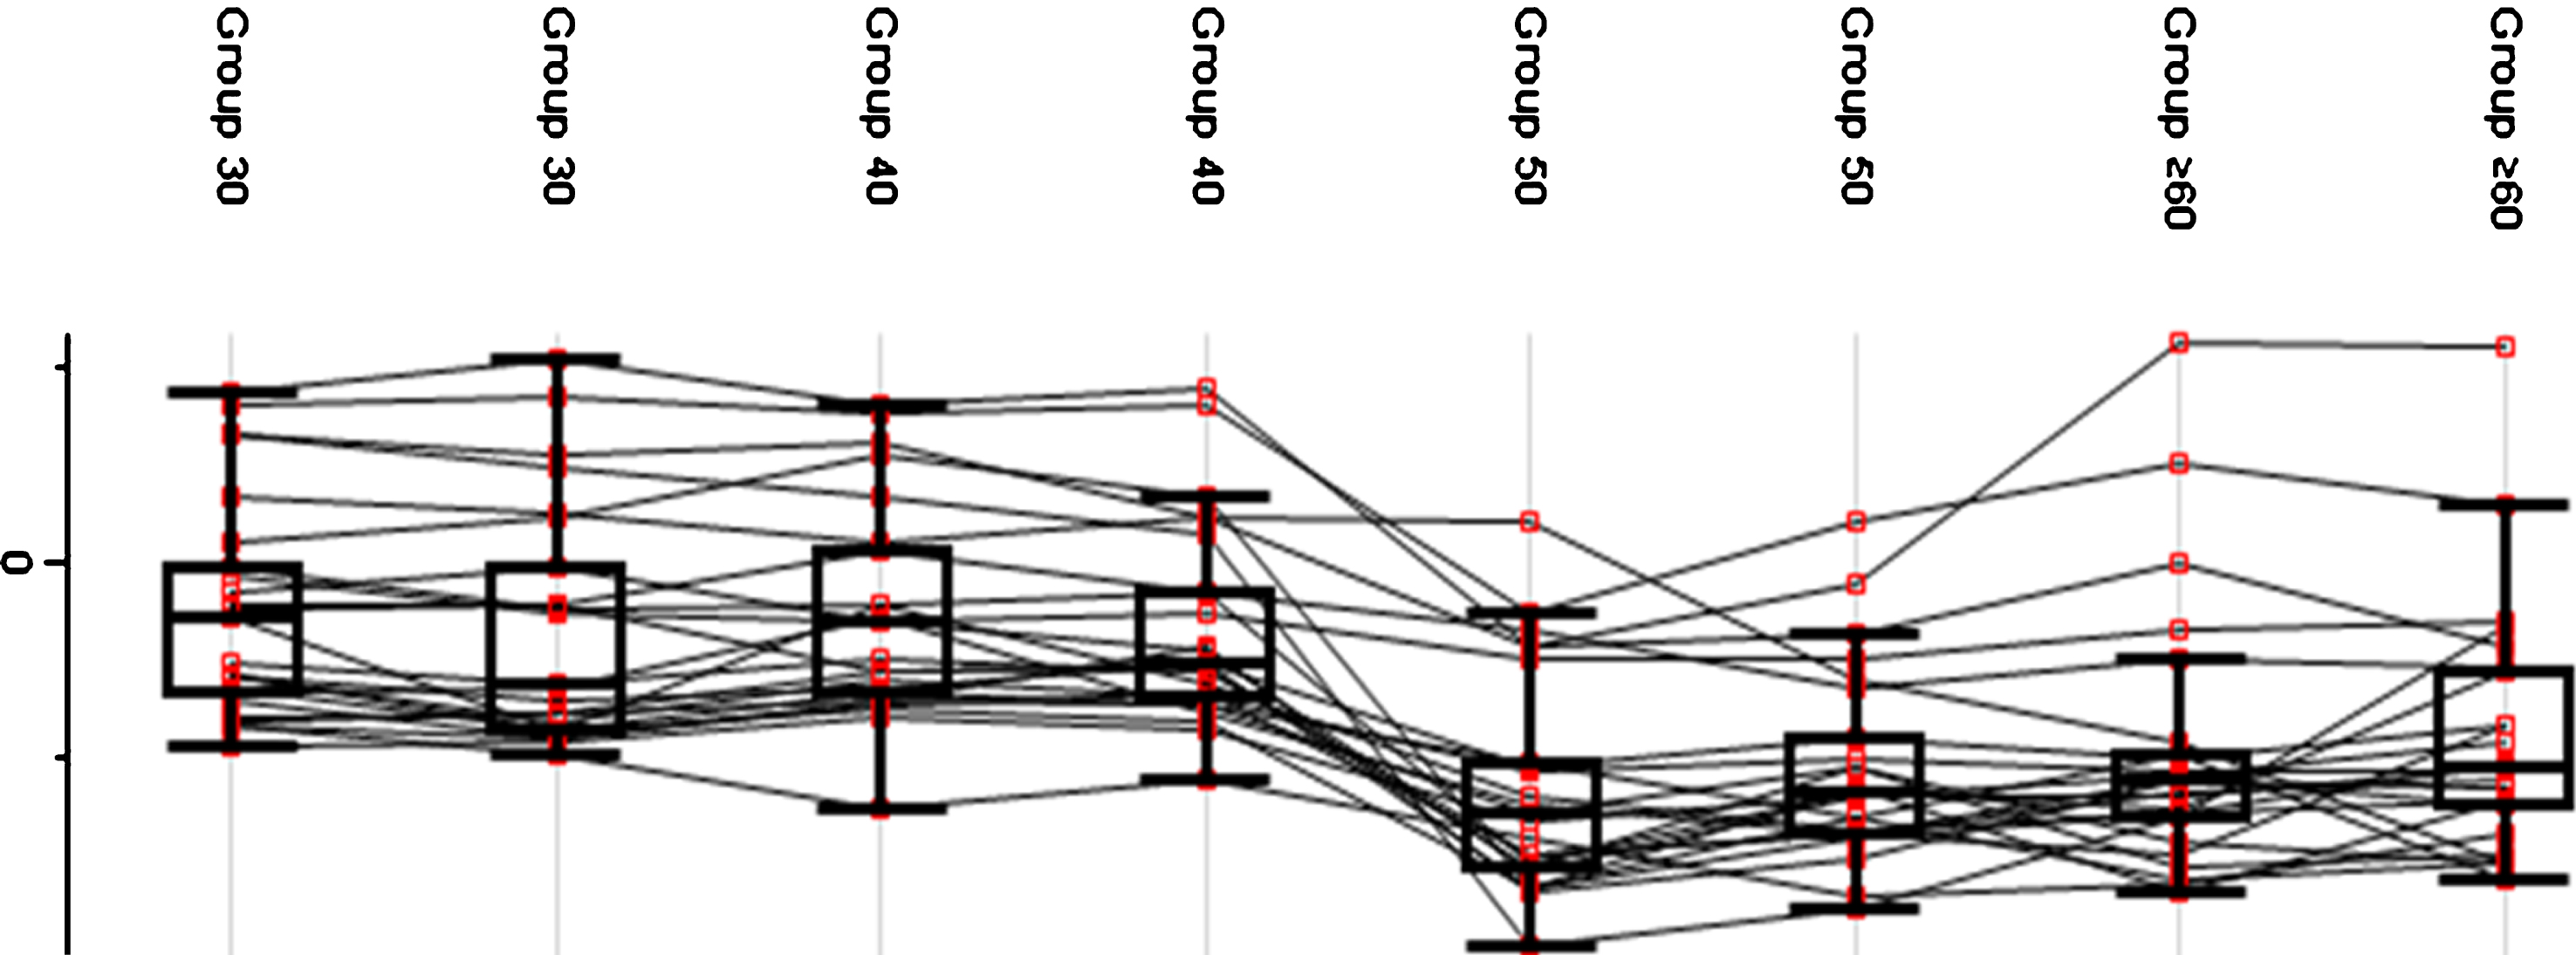
A fluctuation in protein expression across age groups was observed (see Fig. 4). Group 30 and Group 40 exhibited a higher average protein expression value compared to Group 50 and Group≥60. The pattern of protein expression shown in the plot indicates a possible reference age as a critical point of transition. Group 30 and Group 40 exhibited a constant trend of protein expression while a deviation was observed between Group 40 and Group 50 in which a decrease in the mean expression indicated a critical transition point. Meanwhile, Group 50 and Group≥60 showed a constant pattern of protein expression, which was lower than Group 30 and Group 40.
Fig.4
Protein expression value in each age group. The generated box plot did not reflect the distribution of the average expression of the proteins but rather the changes of protein expression within each age group.
Biochemical pathways involved with aging
We observed the involvement of several biological pathways during the progression of aging, which highlights the significance of protein capacity for physiological functions during aging. Annotated ontology of molecular function, cellular components, and biological process analysis showed that peptidase inhibitor activity (GO:0030414), lipase activity (GO:0016298), and peroxidase activity (GO:0004601) showed the highest fold enrichment in molecular function with fold values of≥100, 39.72, and 35.31, respectively (see Table 6). The macromolecular complex, neuronal cell body, and synapse were showed the highest fold enrichment among cellular components with fold values of≥100, 68.09, and 24.22, respectively. Regulation of the biological process, the cholesterol metabolic process, and the fatty acid biosynthetic process were the most enriched with fold values of 38.13, 35.75, and 29.79, respectively. The engagement of several biochemical phenomena observed in this study highlights the importance of particular proteins being sustained during aging.
Table 6
Annotated ontology of molecular function, cellular component, and biological process of significantly detected proteins
| Annotated object (GO ID) | Fold Enrichment | p |
| Molecular Function | ||
| Peptidase Inhibitor Activity (GO:0030414) | ≥100 | 0.008 |
| Lipase Activity (GO:0016298) | 39.72 | 0.025 |
| Peroxidase Activity (GO:0004601) | 35.31 | 0.028 |
| Deacetylase Activity (GO:0019213) | 30.75 | 0.032 |
| Serine-Type Endopeptidase Inhibitor Activity (GO:0004867) | 23.25 | 0.029 |
| Transferase Activity, Transferring Acyl Group (GO:0016746) | 22.97 | 0.034 |
| Metallopeptidase Activity (GO:0008237) | 19.59 | 0.047 |
| Serine-type peptidase activity (GO:0008236) | 19.45 | 0.048 |
| Cellular Component | ||
| Macromolecular complex (GO:0032991) | ≥100 | 0.007 |
| Neuronal cell body (GO:0043025) | 68.09 | 0.015 |
| Synapse (GO:0045202) | 24.44 | 0.040 |
| Extracellular space (GO:0005615) | 12.59 | 8.04e–7 |
| Extracellular region (GO:0005576) | 6.31 | 0.040 |
| Biological Process | ||
| Regulation of biological process (GO:0003008) | 38.13 | 0.026 |
| Cholesterol metabolic process (GO:0008203) | 35.75 | 8.10e–5 |
| Fatty acid biosynthetic process (GO:0006633) | 29.79 | 0.033 |
| Response to toxic substance (GO:0009636) | 25.09 | 0.039 |
| Defense response to bacterium (GO:0042742) | 13.92 | 0.009 |
| Protein metabolic process (GO:0019538) | 12.07 | 0.002 |
| Phospholipid metabolic process (GO:0006644) | 9.39 | 0.019 |
| Response to external stimulus (GO:0009605) | 8.67 | 0.022 |
| Proteolysis (GO:0006508) | 6.38 | 0.003 |
| Regulation of biological process (GO:0050789) | 2.95 | 0.024 |
A deeper analysis of the significantly expressed proteins revealed that several biological pathways were affected, which led to the deterioration of cognitive function during aging. Immune system and hemostasis were the most affected pathways considering the differences in protein expression across age groups (see Fig. 5). Interestingly, several cognitive deficits were shown to be related to pathways that support the impact of protein expression on cognitive capacity. Further elaborating on the involved pathways, related networks engaged were interpreted in order to highlight the involvement of age and cognitive function.
Fig.5
Reactome-generated biological pathway [24] involved in promoting particular biological events. The yellow network represents a significantly involved pathway in relation to differentially expressed protein. The grey network represents the pathways that were identified by the Reactome database.
![Reactome-generated biological pathway [24] involved in promoting particular biological events. The yellow network represents a significantly involved pathway in relation to differentially expressed protein. The grey network represents the pathways that were identified by the Reactome database.](https://content.iospress.com:443/media/jad/2019/70-s1/jad-70-s1-jad180511/jad-70-jad180511-g005.jpg)
Protein-protein interaction during aging
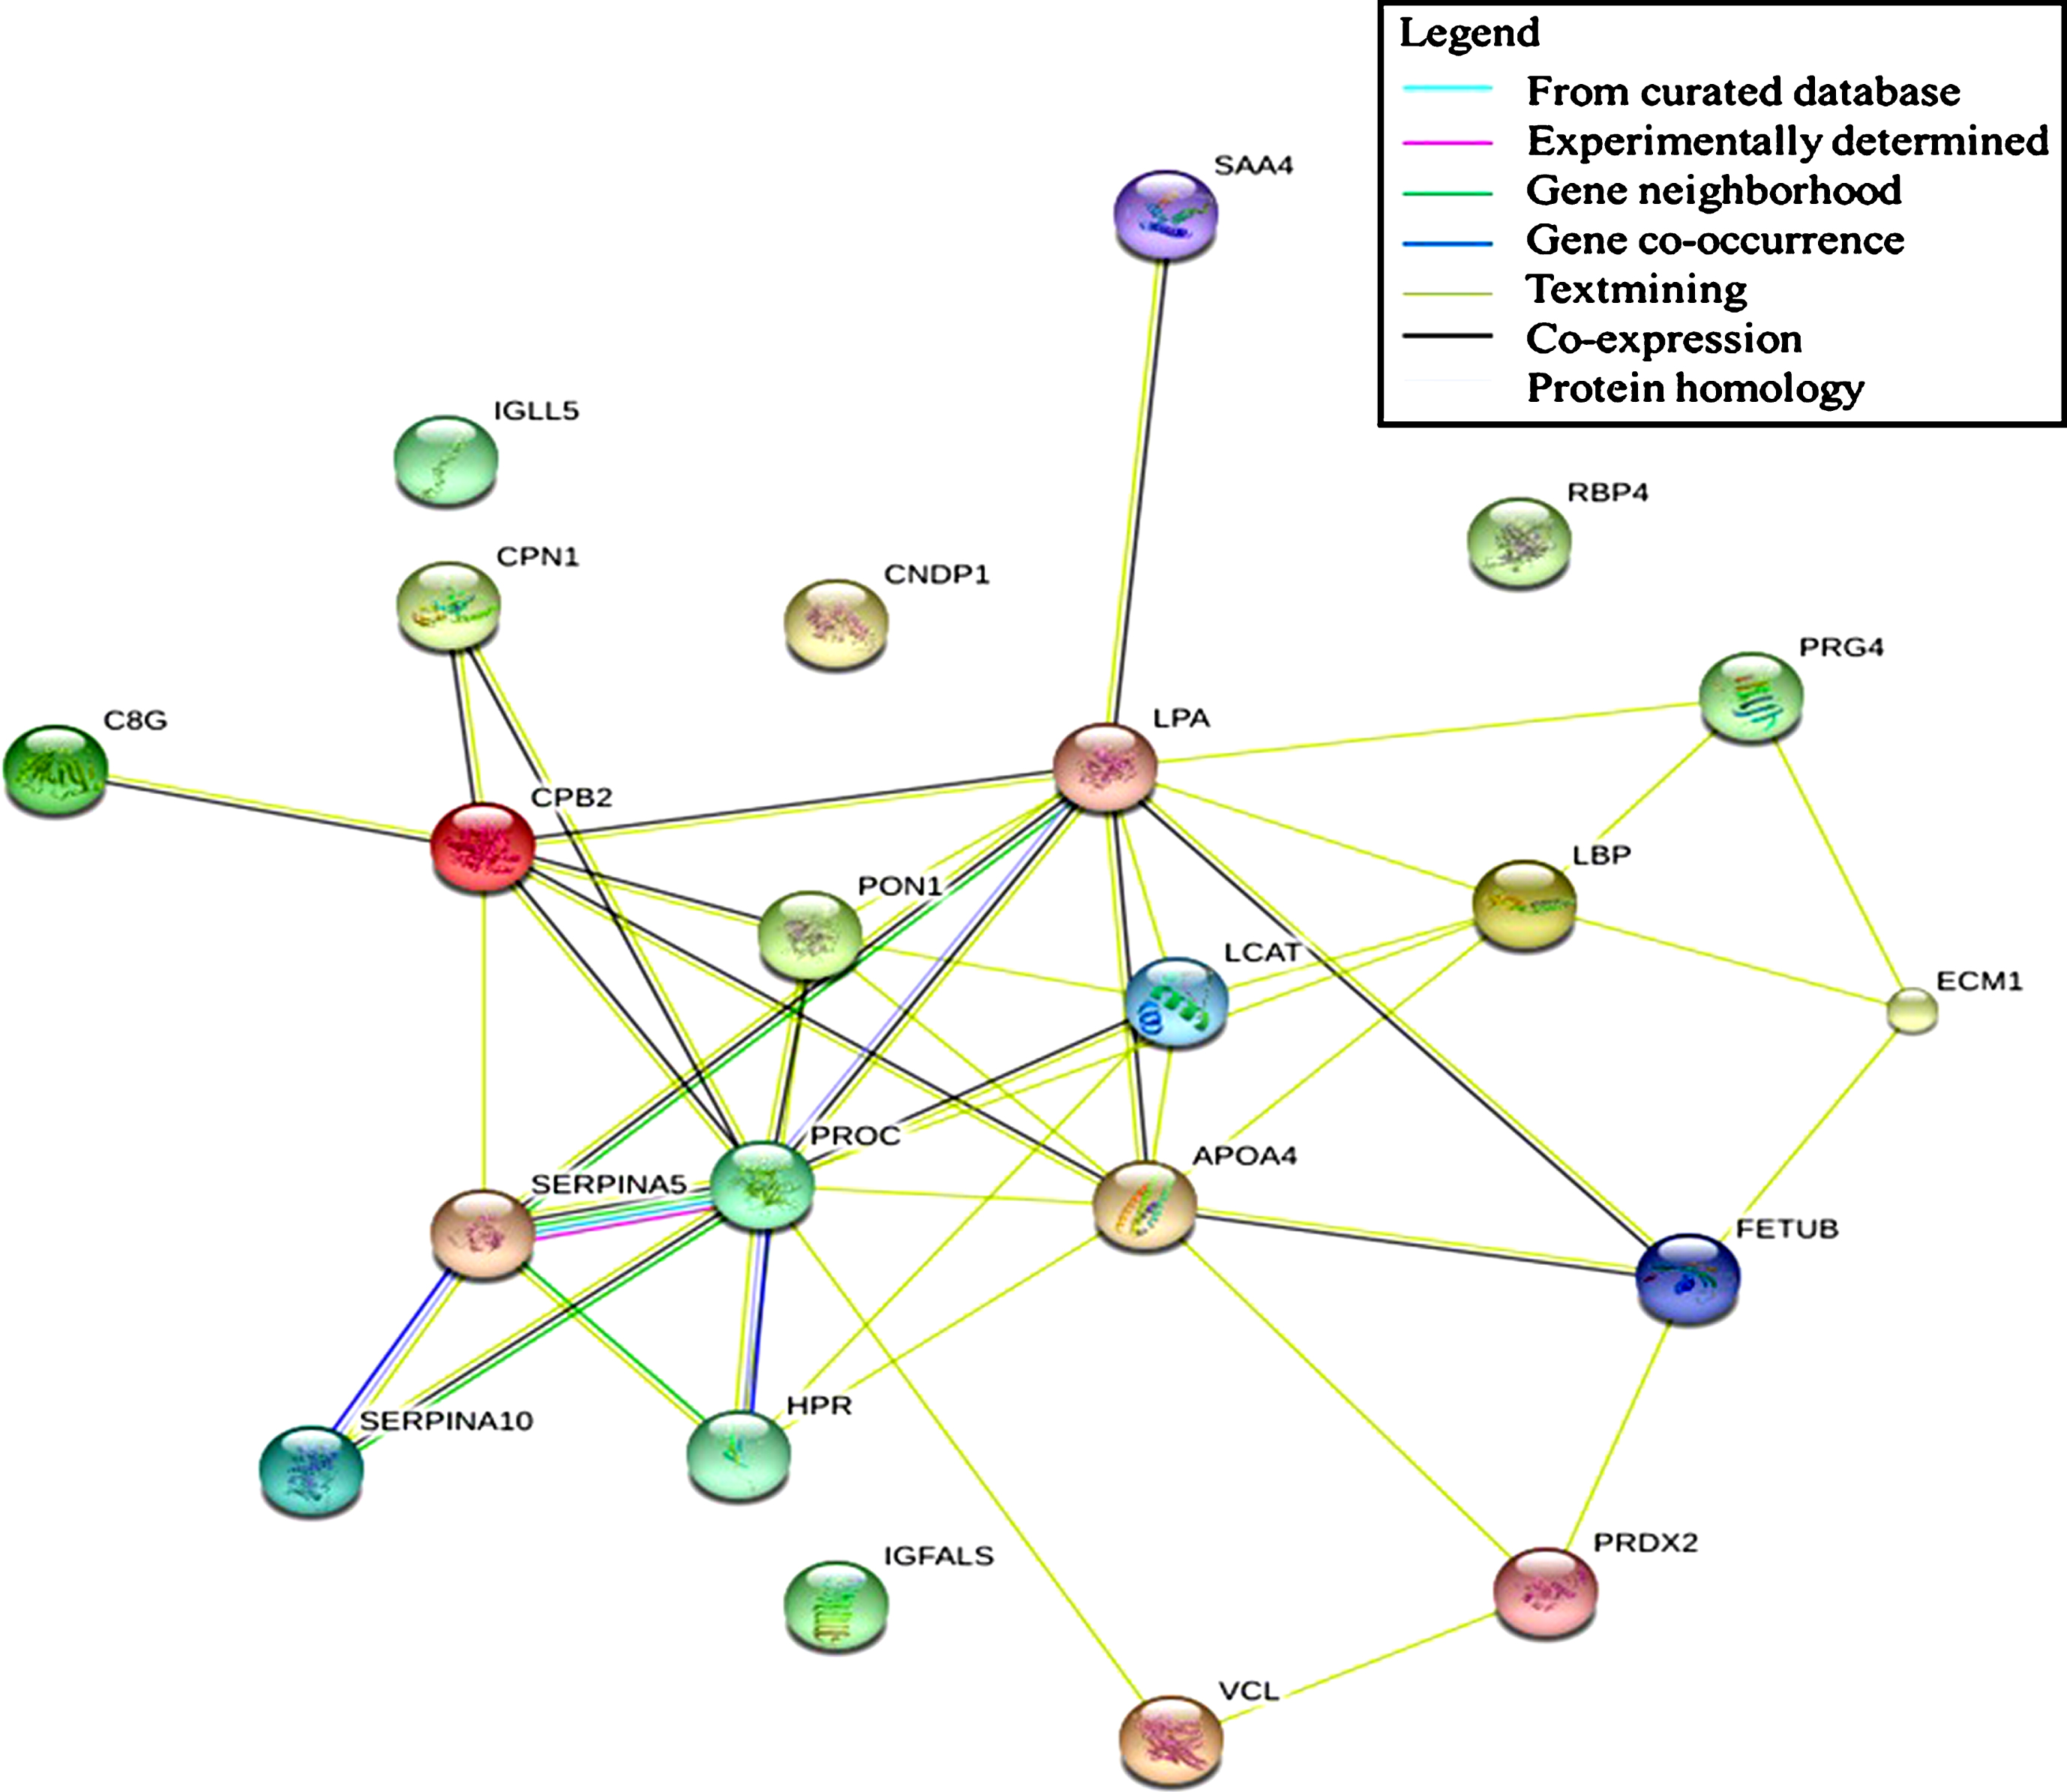
Determination of protein interaction allows visualization of protein regulation. Altering the expression of a specific protein induces physiological changes that can be observed, which leads to a possible manipulation for intervention purposes. The present study found that immune system, hemostasis, and neurodegenerative pathways were associated with differentially expressed proteins observed in aging. These proteins might act as regulators that induce changes when subjected to alteration or manipulation. Our data showed that none of the detected proteins possessed this ability as part of the regulatory protein for the immune system pathway. However, text mining shows that LBP formed a network with several proteins that probably affect the regulation of an innate immune response (see Fig. 6). LBP expression was found to decrease across age groups, which indicates a possible role in the decline of the innate immune response in the studied sample. A similar result was observed in the neurodegenerative pathway in which text mining highlighted the essence of a particular protein in the generated network. The centripetal regulation of this pathway was shown to be mediated by PRDX2, indicating the involvement of this protein in the development of neurodegenerative diseases. In the hemostasis pathway, a significant correlation between several proteins was observed, forming an interconnection and leading to the formation of a regulatory network. PROC and CPB2 were found to be involved in the regulation of this pathway. Both proteins exhibited a decreased expression value and were subsequently responsible for promoting blood clotting.
Fig.6
Protein-protein interaction network of significantly different protein expression generated by STRING: functional network analysis.
DISCUSSION
Demographic status and blood profile differences might influence the data acquisition process, which leads to an inaccurate assessment of an individual cognitive function. Exposure to various external factors can result in different interpretations of a population’s cognitive competency [26, 27]. High levels of education and stable socioeconomic status, for example, could be key predictors for preserving cognitive function with aging [28]. In our studied sample, education could have been an interfering factor, which could diverge from the main objective of the study. Nonetheless, we found no significant correlation between education and cognitive function [29]. Similarly, differing measures from the blood test profile contribute to differences in individual cognitive capability. For example, blood glucose level is a promising indicator of individual cognitive function [30, 31], and fluctuations in creatinine can also affect cognitive competency [32].
Our data showed that several parameters of the blood profile were significantly different across age groups. However, no notable differences were observed between these components of subjects’ blood profiles and the outcome of cognitive tests. Hence, those relationships will not be further discussed.
Our data show that increased age correlates with cognitive deterioration among the Malay population. There is an extensive literature addressing the impact of age on individual cognitive competency [33]. Nonetheless, the rate of cognitive decline varied across the population [34, 35]. Our study demonstrated decreased cognitive function with increasing age in the Malay population, indicating that aging undeniably affects cognitive function. This finding supports the hypothesis that aging contributes to cognitive competency, and the degree of cognitive decline varies across different populations, indicating the influence of environmental factors. This further suggests that specific demographic traits contribute to cognitive competency within a population. In order to further understand the molecular processes, determining the protein profile of the human biological system can be a vital platform. Proteins carry out many functions in the body, and determining their expression and involvement in biochemical pathways at different stages of the lifespan can be informative for unraveling the association between aging and cognitive function within a population.
Regulation of protein expression was measured in this study and displayed in the generated heat map. Most of the significantly expressed proteins were upregulated in Group 30 and Group 40 while Group 50 and Group≥60 showed downregulation of those proteins. There was significant regulation of the proteins upon reaching a particular age, as shown in the heat map. A similar representation of protein expression is displayed in the box plot. The transition of the proteins’ expression pattern was clearly indicated by a significant shift in age, particularly between Group 40 and Group 50. The significant disparity in protein expression across age groups reflects the fact that alteration in protein expression occurs in parallel to advancing age. Our results showed a critical separation point in distinguishing the younger from the older individuals. Furthermore, our findings pinpoint a critical phase of aging for the Malay population based on differential protein expression. In a previous study, Kitani [36] reported that most of the biological entity declined with advancing age. This finding is a promising indication of aging within the studied population.
The transition in protein expression exhibited across age groups can be interpreted more meaningfully by determining protein’s role in the development of physiological functions. Understanding protein ontology from different aspects of the biological perspective will highlight the relationship between age and cognitive function comprehensively.
As for molecular functions, peptidase/protease activity inhibitors (GO:0030414) exhibited the highest enrichment fold in parallel with increasing age. The specific protein affected, SERPINA5, was relatively declined with age. SERPINA5 is important in the blood clot regulatory mechanism by which its presence impedes excessive blood coagulation [37]. Many studies have reported a positive correlation between age and blood clot activity [36, 37]. Persistent elevation of blood clumping not only induces hemostasis-related disorders but also promotes deterioration of cognitive function [38]. However, there was no specific reference that directly showed the association of SERPINA5 with age and cognition. SERPINA5 has been shown to inhibit the progression of blood clots, and its declining expression observed in this study might indicate that blood clotting increases with age. This could be one factor involved with cognitive decline among the Malay subjects studied.
The macromolecular complex (GO:0032991) and neuronal cell body (GO:0043025) were among the cellular components that showed the highest enrichment fold compared to other components. AOPA4 is the protein involved in the macromolecular complex that was affected by aging. Previous studies reported that APOA4 expression declines in the aging human body, and some studies reported its association with age-related diseases [39, 40]. Similarly, we found decreased expression of APOA4 with increasing age. However, its expression was increased in the older age group. Considering that our study did not specifically measure the functional changes of APOA4 with age, polymorphism might explain the induction of its expression in older subjects. Elevation of APOA4 expression in the body probably occurs as a result of increased levels of circulating cholesterol. Nevertheless, taking into account the lipid status and LCAT expression of Group≥60, it was indeed contradictory with APOA4 expression. At this particular point, a different isoform rooted from polymorphism activity [41] might occur, leading to the individual lipid status [42]. Increased cholesterol promotes cognitive deterioration [43]. The changes in APOA4 expression shown in Group≥60 seem like a positive output, but there was probably no biological benefit from it, and it might have induced cognitive decline in the population [39]. Further studies are needed to confirm this hypothesis, especially in relation to the polymorphic phenomenon of APOA4. Apart from the macromolecular complex, involvement of the neuronal cell body (GO:0043025) can potentially broaden the discussion on the impact of protein expression on cognitive function with aging. We found that VCL regulation was among the salient activities of the neuronal cell body. The adhesion mechanism shown by VCL is essential in various cellular processes. Its presence induces signal transduction that causes an integrin response on a specific ligand [44], which regulates neuronal cell growth. Our results showed that the expression of VCL was decreased with increasing age. In line with our findings, previous studies have reported similar outcomes and showed the consequences of reduced VCL expression on specific organs [45, 46]. Regarding its role in the neuronal cell body, formation of the neuronal growth cone is the most prominent mechanism involved in the development of the neuronal cell morphology [47]. Although VCL plays a vital role in the progression of neuronal cell structure, age-related studies focusing on the impact of proteins on neurons are still scarce. As current data are inadequate to explain the association between VCL and neuronal structure with aging, our result raises the question of how a decline in VCL expression might affect its role as a primary mechanosensor in the development of the neuron itself. Additionally, this condition may reflect the reduction in cognitive competency across age groups, as the integrity of neurons may be affected.
In the biological process, the processing system (GO:0003008) exhibited the highest enrichment fold compared to the other components. Generally, the processing system involved various activities at the multicellular or organ levels, and the stress response (GO:0006950) has been identified as a process related to age and cognition. Our findings showed that APOA4 might contribute to the regulation of stress with aging. The stress response includes body homeostasis such as reaction to the surrounding temperature, the immune system, and the presence of radical species. Oxidative imbalance results in oxidative stress, which is physiologically related to age and cognition. The role of APOA4 in reducing oxidative stress was the center of discussion relative to its expression. Reductions in APOA4 expression with age without pathological consequences have not been reported. However, since the induction of APOA4 could drive age-related diseases [39], a decline in its expression is relevant to aging. Decreased APOA4 expression indirectly leads to negative effects on oxidative regulation [48] and subsequently affects individual cognitive competency [39]. Nonetheless, we found that expression of this protein was increased in the oldest group. No other studies have reported such an anomaly, but the induction of APOA4 could be due to circumstances of the body regardless of age. Elevation of APOA4 could be due to a compensatory mechanism [40] in balancing the total circulating cholesterol (such as reducing the possibility of increased lipid peroxidation) or induction due to variability in APOA4 sequences with age [49]. Further studies need to examine whether APOA4 expression affects cognitive function.
The ontology analysis of differentially expressed proteins showed that these proteins impact cognitive function with increasing age. Since the detailed mechanism involving each associated phenomenon is not clearly understood, a pathway analysis was conducted. Several related pathways were identified that directly influenced the effect of age on cognitive function. One pathway found to play an important role is the immune system. Changes in the immune system with the progression of age were reported in a previous study [50], which is in line with the findings of the present study. This could be explained by an immunosenescence phenomenon. An involvement of immunosenescence in cognitive deterioration has been reported previously [51, 52]. Based on the acquired proteins IGKV3–11, IGLV3–19, IGLC1, C8, and CPN1, the innate immune system was regarded as the centripetal regulation that was affected by age. Hence, advanced age results in a decline of immune system functioning, which leads to a decline in cognitive competency [51].
Aside from the immune system, regulation of the hemostasis mechanism was also shown to have a significant impact on cognitive function. Our results indicated the possibility of increased blood clotting synthesis following the decline in PROC expression. PROC is a protease involved in the deactivation of blood clotting factors Va and VIIIa in the blood coagulation system [53]. The lack of PROC leads to increased blood clotting activity [54]. The correlation of PROC with age has also been extensively reported in previous studies [55]. Hence, our studied sample can be plausibly interpreted as prone to elevation of blood clotting activity in parallel with aging, and PROC should be further highlighted in addressing the deterioration in cognitive function. Involvement of the cell surface interaction at the vascular wall in the hemostasis system hinders comprehensive discussion on the role of differentially expressed proteins observed in this study. Decreased PROC expression, however, acts as a signal to increase vascular wall permeability [56] and to promote resorption of proteins including fibrinogen [57], which subsequently induces blood clotting. As mentioned, PROC expression was decreased with age and consequently acted as a factor to induce escalation of a blood clotting cascade. Accordingly, reduction in PROC expression might clarify the physiological changes in the Malay population, primarily regarding blood clotting with increasing age. Involvement of other proteins such IGKV3–11, IGLV3–19, and IGLC1 in hemostasis as a consequence of aging is scarcely reported, which is a limitation for a thorough interpretation. However, the presence of immunoglobulin in promoting blood clotting is not an unfamiliar phenomenon [58]. Thus, further studies should be carried out to clarify the mechanism involved with the decrement of immunoglobulin expression associated with blood clotting. Previous studies reported that increased immunoglobulin levels led to the activation of a blood clotting cascade [59, 60]. Nonetheless, it is assumed that blood clotting activity was elevated with age as shown by PROC expression. We do not dismiss the possibility of immunoglobulin as a concern, but it requires further study. Increased blood coagulation is a potential factor leading to cognitive decline, as was reported in previous studies [38–61].
Apart from the conditions indirectly related to age and cognition, our findings also highlighted the involvement of proteins that were associated with cognitive degenerative and thus highly relevant in influencing cognitive performance. Both affected pathways were related to degeneration of neurons and were regulated by PRDX2 expression. Generally, aging is associated with increased oxidative stress, and PRDX2 is responsible for balancing ROS to a reasonable concentration [62, 63]. Concurrently, aging also leads to a decline in neuronal activity due to increased oxidative stress [64, 65] and impairment of PRDX2 regulation [66]. Furthermore, unaltered PRDX2 regulation results in an increased ability to preserve cognitive function due to age-linked oxidative damage [67]. Therefore, the involvement of PRDX2 regulation is essential to ensure optimum conditions for the neuron. This might explain cognitive deterioration with increasing age rooted from the neurodegeneration pathway observed in this study.
Highlighting the specific proteins as biomarkers for the association of age and cognitive function is meaningful for clinical reference. Interpretation of protein-protein interactions will provide a detailed regulatory mechanism. Based on the results of the generated protein network, LBP, PRDX2, and PROC demonstrated a possible central regulation in altering other proteins’ expression. Modification of their expression will eventually lead to physiological changes impacting cognitive function. Our study provides a preliminary understanding of the molecular mechanism for the association between age and cognitive function of the Malay population. Further studies are needed to allow for a coherent discussion on the described protein network. The specificity and sensitivity of the protein interaction can be evaluated, focusing on the relationship between age and cognitive function.
In conclusion, the Malaysian population exhibited cognitive deterioration with the progression of age. Alteration of protein expression induced physiological changes leading to cognitive decline. Understanding the interactions between the differentially expressed proteins highlighted in this study may provide an alternative in ameliorating cognitive competency among the Malays and provide a fundamental approach to tackling the issue. Furthermore, data from this study can be a reference for biomarkers in order to implement suitable interventions for Malay individuals in Malaysia with dementia [68]. Although this paper focused on the Malay population, we observed particular proteins such as the peroxiredoxin family that are consistently related to dementia [69–71] and can be a promising consideration for ways to abate this pathological condition worldwide. Hence, this study can be regarded as a supplement to research on dementia, subsequently contributing to the collective effort toward identifying specific proteins involved with the pathological condition. The prospect begins with the Malay population, and it will expand worldwide with ample data on the incidence of dementia.
ACKNOWLEDGMENTS
We would like to express our appreciation and gratitude for all individuals who were involved directly or indirectly in conducting this research, especially the staff of the Department of Biochemistry, UKM. This study was funded by the Ministry of Education Malaysia (grant number LRGS/BU/2012/UKM-UKM/K/04) and Universiti Kebangsaan Malaysia (grant number DIP–2015–004).
Authors’ disclosures available online (https://www.j-alz.com/manuscript-disclosures/18-0511r1)
REFERENCES
[1] | United Nations, Department of Economic and Social Affairs, Population Division ((2017) ) World Population Ageing 2017, New York. |
[2] | Murman DL ((2015) ) The impact of age on cognition. Semin Hear 36: , 111–121. |
[3] | Prince MJ ((2015) ) World Alzheimer Report 2015: The global impact of dementia: An analysis of prevalence, incidence, cost and trends. Alzheimer's Disease International, London. |
[4] | Corrada MM , Brookmeyer R , Paganini-Hill A , Berlau D , Kawas CH ((2010) ) Dementia incidence continues to increase with age in the oldest old: The 90+study. Ann Neurol 67: , 114–121. |
[5] | Roehr S , Luck T , Pabst A , Bickel H , Konig H-H , Liihmann D , Fuchs A , Wolfsgruber S , Wiese B , Weyerer S ((2017) ) Subjective cognitive decline is longitudinally associated with lower health-related quality of life. Int Psychogeriatr 29: , 1939–1950. |
[6] | Lawson RA , Yarnall AJ , Duncan GW , Breen DP , Khoo TK , Williams-Gray CH , Barker RA , Collerton D , Taylor J-P , Burn DJ ((2016) ) Cognitive decline and quality of life in incident Parkinson's disease: The role of attention. Parkinsonism Relat Disord 27: , 47–53. |
[7] | Etters L , Goodall D , Harrison BE ((2008) ) Caregiver burden among dementia patient caregivers: A review of the literature. J Am Assoc Nurse Pract 20: , 423–428. |
[8] | De Fazio P , Ciambrone P , Cerminara G , Barbuto E , Bruni A , Gentile P , Talarico A , Lacava R , Gareri P , Segura-García C ((2015) ) Depressive symptoms in caregivers of patients with dementia: Demographic variables and burden. Clin Interv Aging 10: , 1085. |
[9] | Song F , Poljak A , Kochan NA , Raftery M , Brodaty H , Smythe GA , Sachdev PS ((2014) ) Plasma protein profiling of Mild cognitive impairment and Alzheimer's disease using iTRAQ quantitative proteomics. Proteome Sci 12: , 5. |
[10] | Rowe JW , Kahn RL ((1987) ) Human aging: Usual and successful. Science 237: , 143–149. |
[11] | Fiocco AJ , Yaffe K ((2010) ) Defining successful aging: The importance of including cognitive function over time. Arch Neurol 67: , 876–880. |
[12] | United Nations, Department of Economic and Social Affairs, Population Division ((2015) ) World Population Ageing 2015, New York. |
[13] | Villar F ((2012) ) Successful ageing and development: The contribution of generativity in older age. Ageing Soc 32: , 1087–1105. |
[14] | Dennis H ((2014) ) Successful Aging: Seniors' positive effects on the economy. Los Angeles Daily News, https://www.dailynews.com/2014/08/11/successful-aging-seniors-positive-effects-on-the-economy/, Last updated August 28, 2017, Accessed on January 14, 2018. |
[15] | Riddle DR ((2007) ) Brain aging: Models, methods, and mechanisms. CRC Press, New York. |
[16] | Bobkova NV , Evgen'ev M , Garbuz DG , Kulikov AM , Morozov A , Samokhin A , Velmeshev D , Medvinskaya N , Nesterova I , Pollock A ((2015) ) Exogenous Hsp70 delays senescence and improves cognitive function in aging mice. Proc Natl Acad Sci USA 112: , 16006–16011. |
[17] | Bettcher BM , Wilheim R , Rigby T , Green R , Miller JW , Racine CA , Yaffe K , Miller BL , Kramer JH ((2012) ) C-reactive protein is related to memory and medial temporal brain volume in older adults. Brain Behav Immun 26: , 103–108. |
[18] | Ariffin SR , Omar B , Isa A , Sharif S ((2010) ) Validity and reliability multiple intelligent item using rasch measurement model. Procedia Soc Behav Sci 9: , 729–733. |
[19] | Manavalan A , Mishra M , Feng L , Sze SK , Akatsu H , Heese K ((2013) ) Brain site-specific proteome changes in aging-related dementia. Exp Mol Med 45: , e39. |
[20] | Kendziorski C , Irizarry R , Chen K-S , Haag J , Gould M ((2005) ) On the utility of pooling biological samples in microarray experiments. Proc Natl Acad Sci USA 102: , 4252–4257. |
[21] | Diz AP , Truebano M , Skibinski DO ((2009) ) The consequences of sample pooling in proteomics: An empirical study. Electrophoresis 30: , 2967–2975. |
[22] | Elias JE , Gygi SP ((2007) ) Target-decoy search strategy for increased confidence in large-scale protein identifications by mass spectrometry. Nat Methods 4: , 207–214. |
[23] | Mi H , Poudel S , Muruganujan A , Casagrande JT , Thomas PD ((2015) ) PANTHER version 10: Expanded protein families and functions, and analysis tools. Nucleic Acids Res 44: , D336–D342. |
[24] | Fabregat A , Sidiropoulos K , Garapati P , Gillespie M , Hausmann K , Haw R , Jassal B , Jupe S , Korninger F , McKay S ((2015) ) The reactome pathway knowledgebase. Nucleic Acids Res 44: , D481–D487. |
[25] | Szklarczyk D , Franceschini A , Wyder S , Forslund K , Heller D , Huerta-Cepas J , Simonovic M , Roth A , Santos A , Tsafou KP ((2014) ) STRING v10: Protein-protein interaction networks, integrated over the tree of life. Nucleic Acids Res 43: , D447–D452. |
[26] | Brewster PW , Melrose RJ , Marquine MJ , Johnson JK , Napoles A , MacKay-Brandt A , Farias S , Reed B , Mungas D ((2014) ) Life experience and demographic influences on cognitive function in older adults. Neuropsychology 28: , 846. |
[27] | Farias ST , Mungas D , Hinton L , Haan M ((2011) ) Demographic, neuropsychological, and functional predictors of rate of longitudinal cognitive decline in Hispanic older adults. Am J Geriatr Psychiatry 19: , 440–450. |
[28] | Hatch SL , Feinstein L , Link BG , Wadsworth ME , Richards M ((2007) ) The continuing benefits of education: Adult education and midlife cognitive ability in the British 1946 birth cohort. J Gerontol B Psychol Sci Soc Sci 62: , S404–S414. |
[29] | Amir Hamzah AIZ, Abu Bakar ZH, Abdul Sani NF, Tan JK, Ahmad Damanhuri MH, Nor Aripin KN, Mohd Rani MD, Noh NA, Razali R, Mohamad M, Makpol S, Mazlan M, Abdul Hamid H, Wan Ngah WZ ((2016) ) Relationship between education and cognitive performance among healthy Malay adults. Sains Malays 45: , 1371–1379. |
[30] | Feldman J , Barshi I ((2007) ) The effects of blood glucose levels on cognitive performance: A review of the literature. NASA Technical Report Server, California. |
[31] | Barnes JN , Joyner MJ ((2012) ) Sugar highs and lows: The impact of diet on cognitive function. J Physiol 590: , 2831–2831. |
[32] | Regina SP , Johnson L ((2014) ) Elevated serum creatinine levels differentially impact cognitive functioning among Mexican American elders and non-Hispanic whites: A Project Frontier Study. Research Appreciation Day Conference, Texas. |
[33] | Deary IJ , Corley J , Gow AJ , Harris SE , Houlihan LM , Marioni RE , Penke L , Rafnsson SB , Starr JM ((2009) ) Age-associated cognitive decline. Br Med Bull 92: , 135–152. |
[34] | Hayes SM , Alosco ML , Hayes JP , Cadden M , Peterson KM , Allsup K , Forman DE , Sperling RA , Verfaellie M ((2015) ) Physical activity is positively associated with episodic memory in aging. J Int Neuropsychol Soc 21: , 780–790. |
[35] | Emmerson RY , Dustman RE , Shearer DE , Turner CW ((1989) ) P3 latency and symbol digit performance correlations in aging. Exp Aging Res 15: , 151–159. |
[36] | Kitani K ((2007) ) What really declines with age? Age 29: , 1–14. |
[37] | Suzuki K ((2008) ) The multi-functional serpin, protein C inhibitor: Beyond thrombosis and hemostasis. J Thromb Haemost 6: , 2017–2026. |
[38] | Quinn T , Gallacher J , Deary I , Lowe G , Fenton C , Stott D ((2011) ) Association between circulating hemostatic measures and dementia or cognitive impairment: Systematic review and meta-analyzes. J Thromb Haemost 9: , 1475–1482. |
[39] | Lin Q , Cao Y , Gao J ((2015) ) Decreased expression of the APOA1-APOC3-APOA4 gene cluster is associated with risk of Alzheimer's disease. Drug Des Devel Ther 9: , 5421. |
[40] | Basak T , Tanwar VS , Bhardwaj G , Bhardwaj N , Ahmad S , Garg G , Sreenivas V , Karthikeyan G , Seth S , Sengupta S ((2016) ) Plasma proteomic analysis of stable coronary artery disease indicates impairment of reverse cholesterol pathway. Sci Rep 6: , 28042. |
[41] | Ueffing N , Singh KK , Christians A , Thorns C , Feller AC , Nagl F , Fend F , Heikaus S , Marx A , Zotz RB ((2009) ) A single nucleotide polymorphism determines protein isoform production of the human c-FLIP protein. Blood 114: , 572–579. |
[42] | Ota VK , Chen ES , Ejchel TF , Furuya TK , Mazzotti DR , Cendoroglo MS , Ramos LR , Araujo LQ , Burbano RR , Smith MdAC ((2011) ) APOA4 polymorphism as a risk factor for unfavorable lipid serum profile and depression: A cross-sectional study. J Investig Med 59: , 966–970. |
[43] | van Vliet P ((2012) ) Cholesterol and late-life cognitive decline. J Alzheimers Dis 30: , S147–S162. |
[44] | Peng X , Nelson ES , Maiers JL , DeMali KA ((2011) ) New insights into vinculin function and regulation. Int Rev Cell Mol Biol 287: , 191. |
[45] | Kim H-J , Woo SJ , Suh EJ , Ahn J , Park JH , Hong HK , Lee JE , Ahn SJ , Hwang DJ , Kim KW ((2014) ) Identification of vin-culin as a potential plasma marker for age-related macular degeneration. Invest Ophthalmol Vis Sci 55: , 7166–7176. |
[46] | Bradford WH , Omens JH , Sheikh F ((2017) ) Vinculin at the heart of aging. Ann Transl Med 5: , 62. |
[47] | Igarashi M , Saito S , Komiya Y ((1990) ) Vinculin is one of the major endogenous substrates for intrinsic tyrosine kinases in neuronal growth cones isolated from fetal rat brain. FEBS J 193: , 551–558. |
[48] | Ding J ((2009) ) A proteomic approach to identify biomarkers of growth hormone and aging, Ohio University, Ohio. |
[49] | Garasto S , Rose G , Derango F , Berardelli M , Corsonello A , Feraco E , Mari V , Maletta R , Bruni A , Franceschi C ((2003) ) The study of APOA1, APOC3 and APOA4 variability in healthy ageing people reveals another paradox in the oldest old subjects. Ann Hum Genet 67: , 54–62. |
[50] | Weiskopf D , Weinberger B , Grubeck-Loebenstein B ((2009) ) The aging of the immune system. Transpl Int 22: , 1041–1050. |
[51] | Martorana A , Bulati M , Buffa S , Pellicano M , Caruso C , Candore G , Colonna-Romano G ((2012) ) Immunose-nescence, inflammation and Alzheimer's disease. Longev Healthspan 1: , 8. |
[52] | Di Benedetto S , Müller L , Wenger E , Duzel S , Pawelec G ((2017) ) Contribution of neuroinflammation and immunity to brain aging and the mitigating effects of physical and cognitive interventions. Neurosci Biobehav Rev 75: , 114–128. |
[53] | Kovacs KB , Pataki I , Bardos H , Fekete A , Pfliegler G , Haramura G , Gindele R , Komaromi I , Balla G , Adany R ((2015) ) Molecular characterization of p. Asp77Gly and the novel p. Ala163Val and p. Ala163Glu mutations causing Protein C deficiency. Thromb Res 135: , 718–726. |
[54] | Schafer AI ((1985) ) The hypercoagulable states. Ann Intern Med 102: , 814–828. |
[55] | Hager K , Setzer J , Vogl T , Voit J , Platt D ((1989) ) Blood coagulation factors in the elderly. Arch Gerontol Geriatr 9: , 277–282. |
[56] | Gilbert RE , Marsden PA ((2008) ) Activated protein C and diabetic nephropathy. N Engl J Med 358: , 1628. |
[57] | Nagy JA , Benjamin L , Zeng H , Dvorak AM , Dvorak HF ((2008) ) Vascular permeability, vascular hyperpermeability and angiogenesis. Angiogenesis 11: , 109–119. |
[58] | Alliot C , Rapin J , Besson M , Bedjaoui F , Messouak D ((2001) ) Pulmonary embolism after intravenous immunoglobulin. J R Soc Med 94: , 187–188. |
[59] | Pierangeli S , Liu XW , Barker J , Anderson G , Harris EN ((1995) ) Induction of thrombosis in a mouse model by IgG, IgM and IgA immunoglobulins from patients with the antiphospholipid syndrome. Thromb Haemost 74: , 1361–1367. |
[60] | Arman M , Krauel K ((2015) ) Human platelet IgG Fc receptor FcγRIIA in immunity and thrombosis. J Thromb Haemost 13: , 893–908. |
[61] | Stott DJ , Robertson M , Rumley A , Welsh P , Sattar N , Packard CJ , Shepherd J , Trompet S , Westendorp RG , de Craen AJ ((2010) ) Activation of hemostasis and decline in cognitive function in older people. Arterioscler Thromb Vasc Biol 30: , 605–611. |
[62] | Ha MK , Soo Cho J , Baik OR , Lee KH , Koo HS , Chung KY ((2006) ) Caenorhabditis elegans as a screening tool for the endothelial cell-derived putative aging-related proteins detected by proteomic analysis. Proteomics 6: , 3339–3351. |
[63] | Zhao F , Wang Q ((2012) ) The protective effect of peroxiredoxin II on oxidative stress induced apoptosis in pancreatic ß-cells. Cell Biosci 2: , 22. |
[64] | Urano S , Sato Y , Otonari T , Makabe S , Suzuki S , Ogata M , Endo T ((1998) ) Aging and oxidative stress in neurodegeneration. Biofactors 7: , 103–112. |
[65] | Shukla V , Mishra SK , Pant HC ((2011) ) Oxidative stress in neurodegeneration. Adv Pharmacol Sci 2011: . |
[66] | Park MH , Jo M , Kim YR , Lee C-K , Hong JT ((2016) ) Roles of peroxiredoxins in cancer, neurodegenerative diseases and inflammatory diseases. Pharmacol Ther 163: , 1–23. |
[67] | Kim S-U , Jin M-H , Kim YS , Lee S-H , Cho YS , Cho K-J , Lee K-S , Kim YI , Kim GW , Kim J-M ((2011) ) Peroxiredoxin II preserves cognitive function against age-linked hippocam-pal oxidative damage. Neurobiol Aging 32: , 1054–1068. |
[68] | Statista, Projected Number of People With Dementia in Malaysia in 2015, 2030 and 2050, https://www.statista.com/statistics/738332/malaysia-projected-number-of-people-with-dementia/, Accessed 12 August 2018. |
[69] | Przedborski S ((2007) ) Peroxiredoxin-2 links Cdk5 to neurodegeneration. Nat Med 13: , 907. |
[70] | Kim S , Fountoulakis M , Cairns N , Lubec G ((2001) ) Protein levels of human peroxiredoxin subtypes in brains of patients : with Alzheimer's disease and Down syndrome. In Protein Expression in Down Syndrome Brain Springer, Lubec G. ed. Springer, Vienna, pp. 223–235. |
[71] | Power JH , Asad S , Chataway TK , Chegini F , Manavis J , Temlett JA , Jensen PH , Blumbergs PC , Gai W-P ((2008) ) Peroxiredoxin 6 in human brain: Molecular forms, cellular distribution and association with Alzheimer's disease pathology. Acta Neuropathol 115: , 611–622. |

