
Imaging Response of Antiangiogenic and Immune-Oncology Drugs in Metastatic Renal Cell Carcinoma (mRCC): Current Status and Future Challenges
Abstract
This report aims to review criteria which have been proposed for treatment evaluation in mRCC under anti-angiogenic and immune-oncologic therapies and discuss future challenges for imagers.
RECIST criteria seem to only partially reflect the clinical benefit derived from anti-angiogenic drugs in mRCC. New methods of analysis propose to better evaluate response to these drugs, including a new threshold for size criteria (–10%), attenuation (Choi and modified Choi criteria), functional imaging techniques (perfusion CT, ultrasound or MRI), and new PET radiotracers.
Imaging of progression is one of the main future challenges facing imagers. It is progression and not response that will trigger changes in therapy, therefore it is tumour progression that should be identified by imaging techniques to guide the oncologist on the most appropriate time to change therapy. Yet little is known on dynamics of tumour progression, and much data still needs to be accrued to understand it. Finally, as immunotherapies develop, flare or pseudo-progression phenomena are observed. Studies need to be performed to determine whether imaging can distinguish between patients undergoing pseudo-progression for which therapy should be continued, or true progression for which the treatment must be changed.
INTRODUCTION
Over the last fifteen years, the introduction of new classes of anti-cancer therapies has resulted in a questioning of the expectations of oncologists and imagers on how tumours responded to therapeutic challenges. Under conventional chemotherapies, size was a very good surrogate marker of treatment efficacy, with a decrease in size when tumours responded, and an increase in size when tumours escaped drugs. Imaging response criteria were developed evaluating size, with first the WHO criteria [1], then RECIST (versions 1.0 and 1.1) [2, 3].
Among new targeted drugs, the use of anti-angiogenic (AA) therapies was particularly useful in metastatic renal cell carcinoma (mRCC), a highly vascular tumour, the prognosis of which was largely improved by the introduction of these drugs targeting tumour vessels [4]. However, the use of these drugs resulted in a widespread questioning of the relevance of conventional criteria for the evaluation of tumour response. Instead of resulting in tumour size reduction, best response was often only a stabilisation of disease, despite a benefit in terms of progression-free- and overall survivals [5]. There is therefore dissociation between clinical benefits for patients and apparent efficacy on size measured by imaging. New imaging techniques, but also new methods of analysis may better evaluate response, including new size criteria, attenuation, functional imaging techniques, and new radiotracers.
Immune therapies are, in turn, generating new questions. Indeed, initial increases in size and apparent new lesions are observed under therapy, which in some patients are effectively due to tumour growth, but in others are a consequence of massive and transient immune cell infiltrate preceding response [6]. the RECIST working group [7] proposed new criteria, aiming to standardise tumour evaluation under immunotherapy.
This report aims to review criteria for treatment evaluation in mRCC under anti-angiogenic and immune-oncologic therapies and discuss future challenges for imagers.
TREATMENT RESPONSE CRITERIA IN MRCC UNDER ANTI-ANGIOGENIC THERAPIES (Table 1)
Table 1
Comparison of criteria used to evaluate therapy in metastatic renal cell carcinoma
| Criteria | Measurements | Definition of response | Definition of progression |
| RECIST [2] | Sum of largest diameter (SLD) of target lesions | Decrease of SLD of more than –30% compared to baseline | Increase of SLD of more than +20% compared to nadir |
| RECIST modified threshold | Sum of largest diameter (SLD) of target lesions | Decrease of SLD of more than –10% compared to baseline | Identical to RECIST |
| Choi [21] | Sum of largest diameter (SLD) and mean attenuation of target lesions | Decrease of SLD of more than –10% compared to baseline OR Decrease of mean attenuation of more than –15% compared to baseline | Not specifically evaluated in publications |
| Modified Choi [25] | Sum of largest diameter (SLD) and mean attenuation of target lesions | Decrease of SLD of more than –10% compared to baseline AND Decrease of mean attenuation of more than –15% compared to baseline | Not specifically evaluated in publications |
| iRECIST [7] | Sum of largest diameter (SLD) and mean attenuation of target lesions | Identical to RECIST May occur after an unconfirmed progression | Progression must be confirmed on follow-up imaging |
Size criteria: New –10% threshold for definition of treatment benefit
Contrary to what has been often stated, size changes under AA drugs are correlated to patient outcome. As shown by Grunwald et al. [8], the bigger the tumour shrinkage under therapy, the greater the progression-free survival (PFS) and overall survival (OS) observed. The issue, however, is the threshold that should be used to decide whether patients are benefitting from AA therapy or not. RECIST criteria [2] considered as the standard of response evaluation have repeatedly been shown to be inadequate to evaluate tumour response to anti-angiogenic therapies in mRCC [9–12]. Thiam et al. [12] were the first to study different thresholds of size changes to determine which was the most adequate to predict patient benefit (i.e. significantly improved PFS). A decrease of more than –10% in the sum of target lesions to define tumour response was determined to most effectively predict progression-free survival (median PFS 11.1 vs 5.6 months, i.e. a ratio of the median PFS of 2.0, 95% CI 1.3–2.7), in a retrospective study of use of sunitinib in a phase III trial data and validated in an independent cohort (Fig. 1). It has since then been repeatedly confirmed in various papers, including different anti-angiogenic therapies, and patients under various lines of treatment [9, 11, 13, 14]. Interestingly, this same –10% cut-off for evaluation of response in primary tumours was also predictive of patient benefit (response rate in metastatic sites, OR 2.39, p = 0.022) [15]. We therefore believe it is the most useful criteria which can be used to predict patient response to anti-angiogenic therapy in mRCC.
Fig.1
Progression-free survival in patients above (blue) and below (orange) the –<10% threshold (published with authorisation from [12]).
![Progression-free survival in patients above (blue) and below (orange) the –<10% threshold (published with authorisation from [12]).](https://content.iospress.com:443/media/kca/2017/1-2/kca-1-2-kca170011/kca-1-kca170011-g001.jpg)
Among size-based criteria, publications have considered tumour burden (either as the sum of largest diameters according to RECIST, or as more sophisticated calculations of volume) and tumour growth rate (quantifying the rate of changes in tumour size). Both have shown to be prognostic factors correlating to overall survival, rather than criteria of drug efficacy [16–20].
Criteria based on attenuation
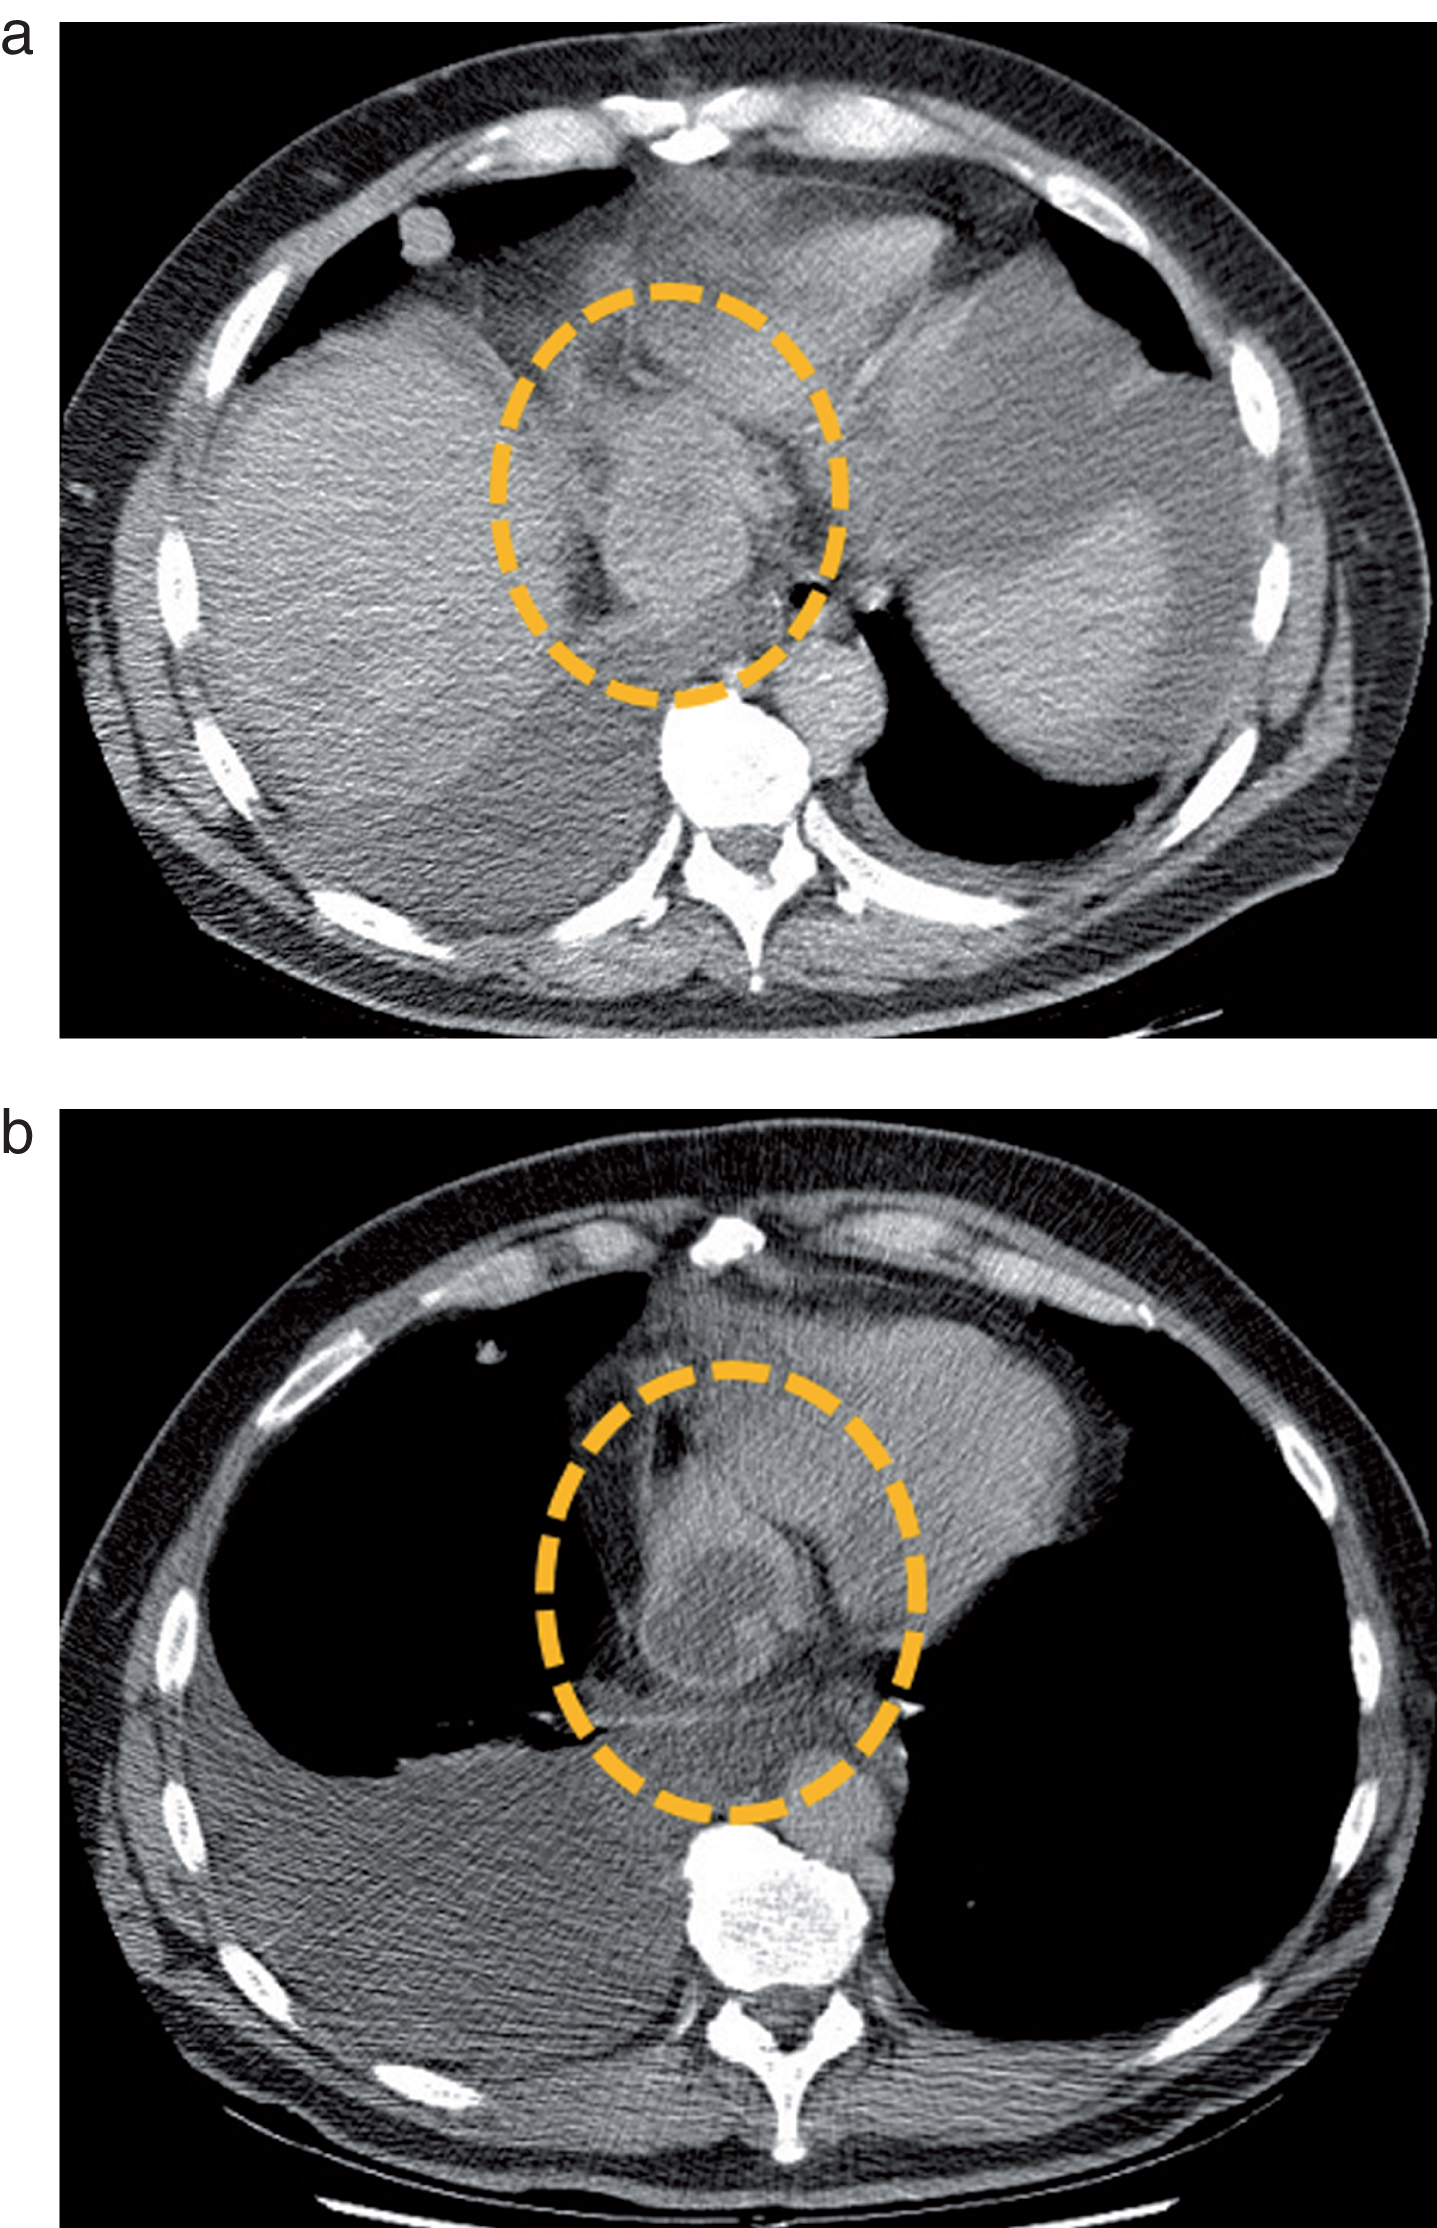
Renal cell carcinoma, and particularly clear cell carcinoma, are hypervascular tumours, and strongly enhance on imaging. It has been frequently observed in clinical routine that RCC metastases appear devascularised after a single cycle of anti-angiogenic therapy (Fig. 2). For this reason, several publications tested criteria combining size and attenuation to predict patient response to AA therapies. The criteria most often used were the Choi criteria, developed to evaluate gastrointestinal tumours (GIST) under imatinib, defining response as a decrease of more than ≥–10% size of the sum of target lesions OR ≥–15% mean attenuation of target lesions [21]. Several authors used Choi criteria to evaluate treatment response [9, 10, 22–26], others modified these criteria by defining response as BOTH a decrease of over ≥–10% size of the sum of target lesions AND over ≥–15% mean attenuation of target lesions measured on the arterial phase [10, 23, 25]. The modified Choi criteria seemed superior to the original criteria to predict outcome. It is of note that the size threshold used in these criteria (–10%) is the same as the one defined as the most significant to reflect patient benefit (previous paragraph). Overall, concerns regarding reproducibility of measuring attenuation have been raised [14], and the added benefit of attenuation compared to the –10% size criteria alone may have contributed to the lack of use of these criteria either in clinical routine or in clinical trials.
Fig.2
Metastatic mediastinal lymph node of a clear cell RCC before (a) and after (b) a single cycle of treatment by sunitinib. The lymph node (dotted circle) enhances homogeneously before therapy, but presents a central devascularized portion after treatment administration. Based on these observations, several teams tested Choi criteria in mRCC.
More complex criteria combining size and attenuation were also proposed, such as SACT [27] and MASS [28, 29], but they too, have not emerged as useful tools.
Imaging heterogeneity
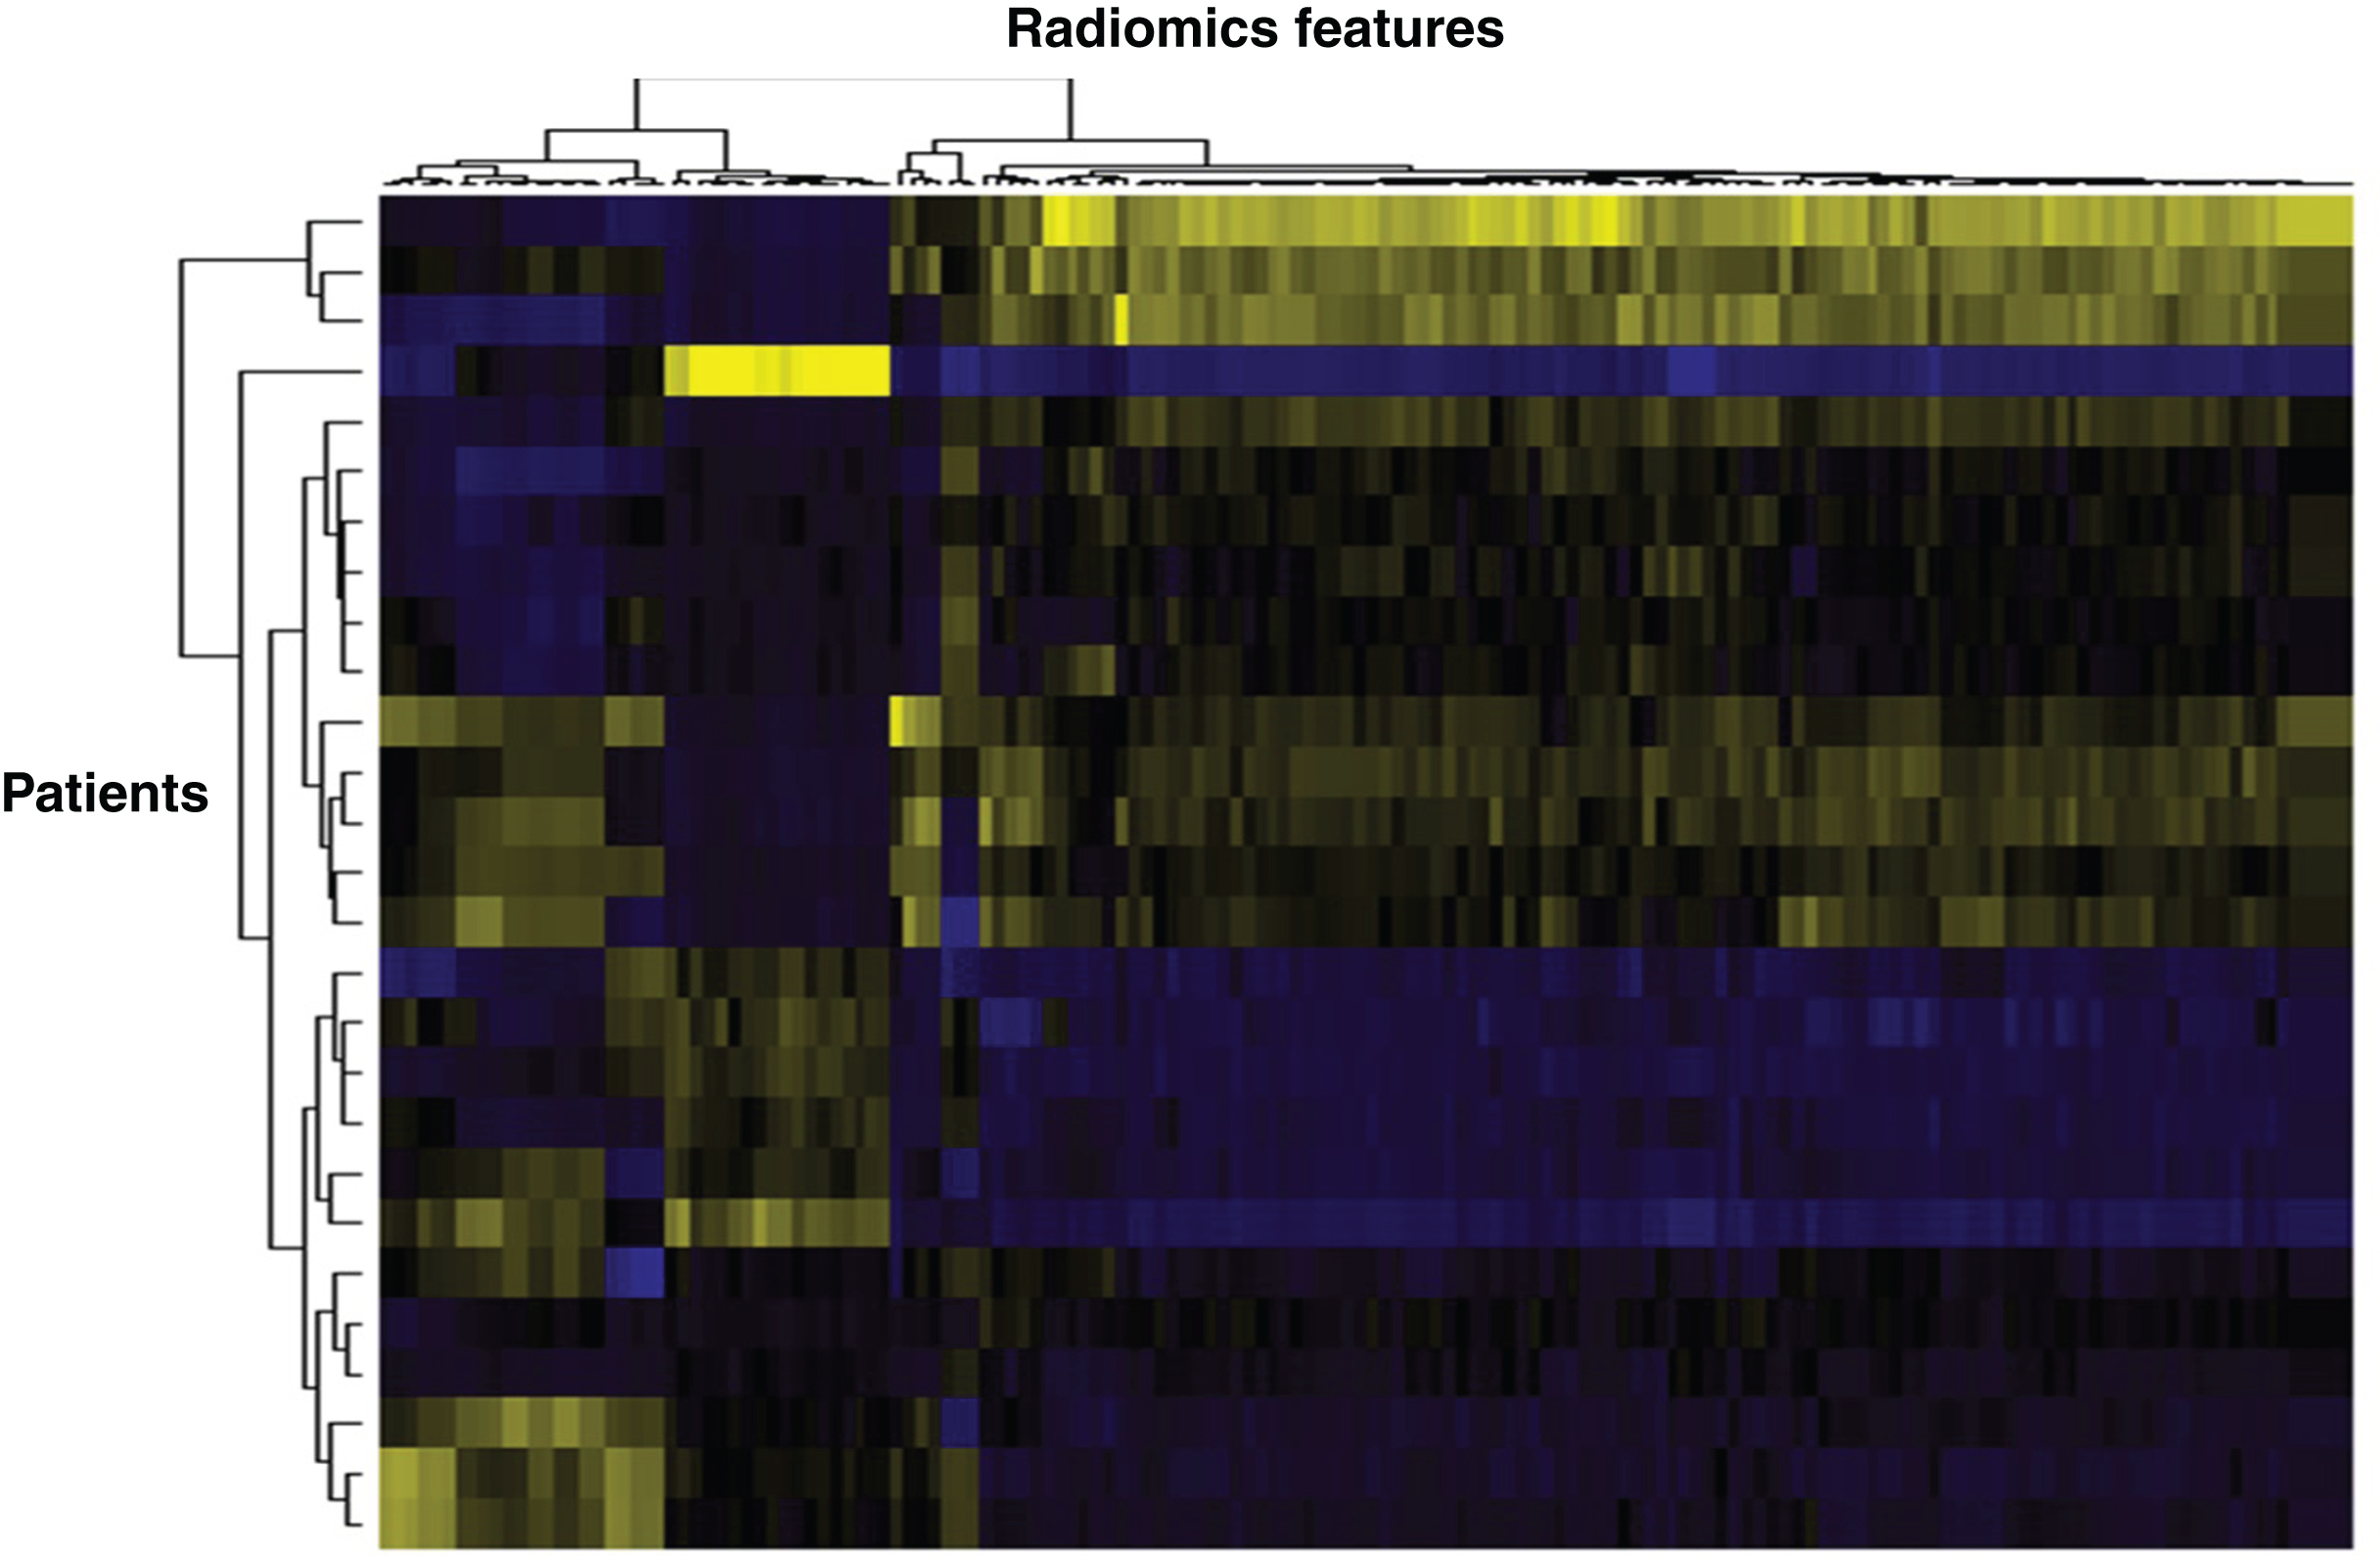
More sophisticated methods of image analysis are being used to quantify tumour heterogeneity on radiological images. Texture analysis refers to mathematical techniques of analysis of pixel signal intensity content and spatial disposition which reflect intra-lesion heterogeneity [30]. The most simple are histogram-derived analyses (which do not however preserve spatial relationships between pixels), which have been used in two publications [31, 32], showing that heterogeneity-related features such as entropy, were independent predictors of OS and PFS. Radiomic goes even further by extracting a very large number (several hundreds) of features from images with no a priori hypothesis [33]. This large number of features can then be analysed according to the informatics and statistical methods developed for genomics (Fig. 3). This is an emerging field, and more studies will be required to understand which are the most relevant parameters, and the requirements in image acquisition and processing for these features to be used either in clinical trials or routine imaging [34, 35].
Fig.3
Heat map based on radiomics features extracted from mRCC patients. Vertically is represented each patient, horizontally each radiomics feature. Such heat maps allow separating patients according to common radiomics profiles, which are then correlated to a given outcome.
Functional imaging: Perfusion and PET
Functional imaging allows quantifying physiological or molecular processes, yielding information not accessible to morphological imaging. Several studies showed the potential of functional imaging techniques for prognosis or prediction of response to therapy [36].
Among these, perfusion imaging was the most studied, whether using ultrasound [37, 38], CT [39] or MRI [40–42]. Perfusion imaging is based on the dynamic acquisition of images before and during injection of a contrast agent, allowing calculating blood flow, blood volume and permeability of tumour vessels. Considering the highly vascular character of renal cell carcinoma, and the anti-angiogenic therapies used, an imaging method quantifying tumour vessels seems the most relevant to evaluate tumour response to these drugs. Perfusion parameters have repeatedly been correlated to progression free- and/or overall survival, under a number of different therapies, most often sorafenib and sunitinib, but each study included only a small number of patients. Lassau et al., led the largest study using DCE-US, including 157 mRCC patients. Such accumulated evidence makes a strong case for perfusion imaging in this indication, yet the implementation of these techniques in routine clinical practice has been hindered by the fact that there is no consensus on the technique to be used, the method of quantification, nor the best parameter.
PET imaging also shows promise in evaluation of mRCC response to therapy. There is uptake of 18FDG (fluoro-deoxy-glucose) in only 60–75% of renal cancers, yet positive FDG standardized uptake value (SUV) was shown to correlate to progression free- and/or overall survival in small studies [43, 44]. 18FDG-PET may be particularly interesting in a small subgroup of patients with papillary non type-2 carcinoma driven by FH mutation [45]. Other tracers have also been used. Hypoxia was evaluated using 18F-MISO (fluoromisonidazole), showing that patients with hypoxic metastases had shorter PFS then those who did not (4.8 vs. 11.3 months, P = 0.02) [46]. This tracer is hard to use in routine, and other more specific tracers are studied, such as the monoclonal antibody girentuximab (or cG250) labelled with 124Iodine for PET [47] or 111Indium for SPECT [48], which specifically targets the cell-surface antigen carbonic anhydrase IX (CAIX) in clear cell renal cell carcinoma.
FUTURE CHALLENGES
Defining progression in mRCC under anti-angiogenic therapy
As shown above, there has been extensive research on evaluation of treatment response to AA therapy in mRCC. However, when treating a mRCC patient, despite a possible initial period of response, tumour evasion to AA drugs inevitably occurs translating into tumour progression [49]. It is progression and not response that will trigger changes in therapy, therefore it is tumour progression that should be identified by imaging techniques to guide the oncologist on the most appropriate time to change therapy. It is currently discussed whether some patients should be treated beyond RECIST-defined progression [50–52]. Unlike treatment response, very little is known about the dynamics of tumour progression. Our routine clinical experience shows that progression may occur at variable rates, very fast and suddenly or slowly and progressively [53]. The threshold for progression defined by RECIST is an increase of 20% in size of target lesions, unequivocal progression of non-target lesions or appearance of new lesions [2]. Yet a 20% increase occurring between two successive imaging work-ups (i.e. 2-3 months) vs. one occurring over a year or more most probably reflect different mechanisms of progression. Also, a 20% increase in a patient with a small number of lesions may not require the same management as one with a large number of lesions and a high tumour burden. Though there is next to nothing in the literature on the subject, criteria such as tumour growth rate [50], quantification of tumour heterogeneity, but also functional imaging techniques may help us understand progression under AA therapy. These studies are however difficult to perform, because therapy management remains currently based on size, and it would be deemed unethical to continue therapy in a control group only to test biomarkers. And once a therapy is changed, it is impossible to assess whether the patient is faring better or worse than if it had been continued. Finally, it is challenging to obtain histological correlates to imaging parameters during progression, since they involve multiple biopsies. Small animal studies may be required to apprehend how imaging may evaluate tumour progression.
Immune therapies
In recent years, major developments in the field of cancer immunology research have led to the emergence of a new strategy for the treatment of cancers, called immunotherapies or immune-oncology (I-O) drugs [54]. These enhance the immune response targeting tumours, either by stimulating specific cells in the immune system or counteracting the negative signals produced by cancer cells that inhibit immune responses. As these new therapies emerge, new challenges are being faced by imagers.
Firstly, the expected rate of response to these therapies are approximately 25% in mRCC [55]. There is no current validated biomarker which allows predicting which patients will respond, though there is active research in this field such as mutational landscape, other immune parameters, like tumour infiltrating immune cells, immune-gene signatures, or “immunoscores” [54]. This is an important challenge since these therapies are costly and may induce specific toxicities (immune-related adverse events, mainly cutaneous, gastrointestinal, pulmonary, or endocrine [56]). Research will be required to determine whether there may be imaging criteria which may help select patients most likely to respond (metastatic localisations, lymph node involvement, tumour heterogeneity, metabolic activity...).
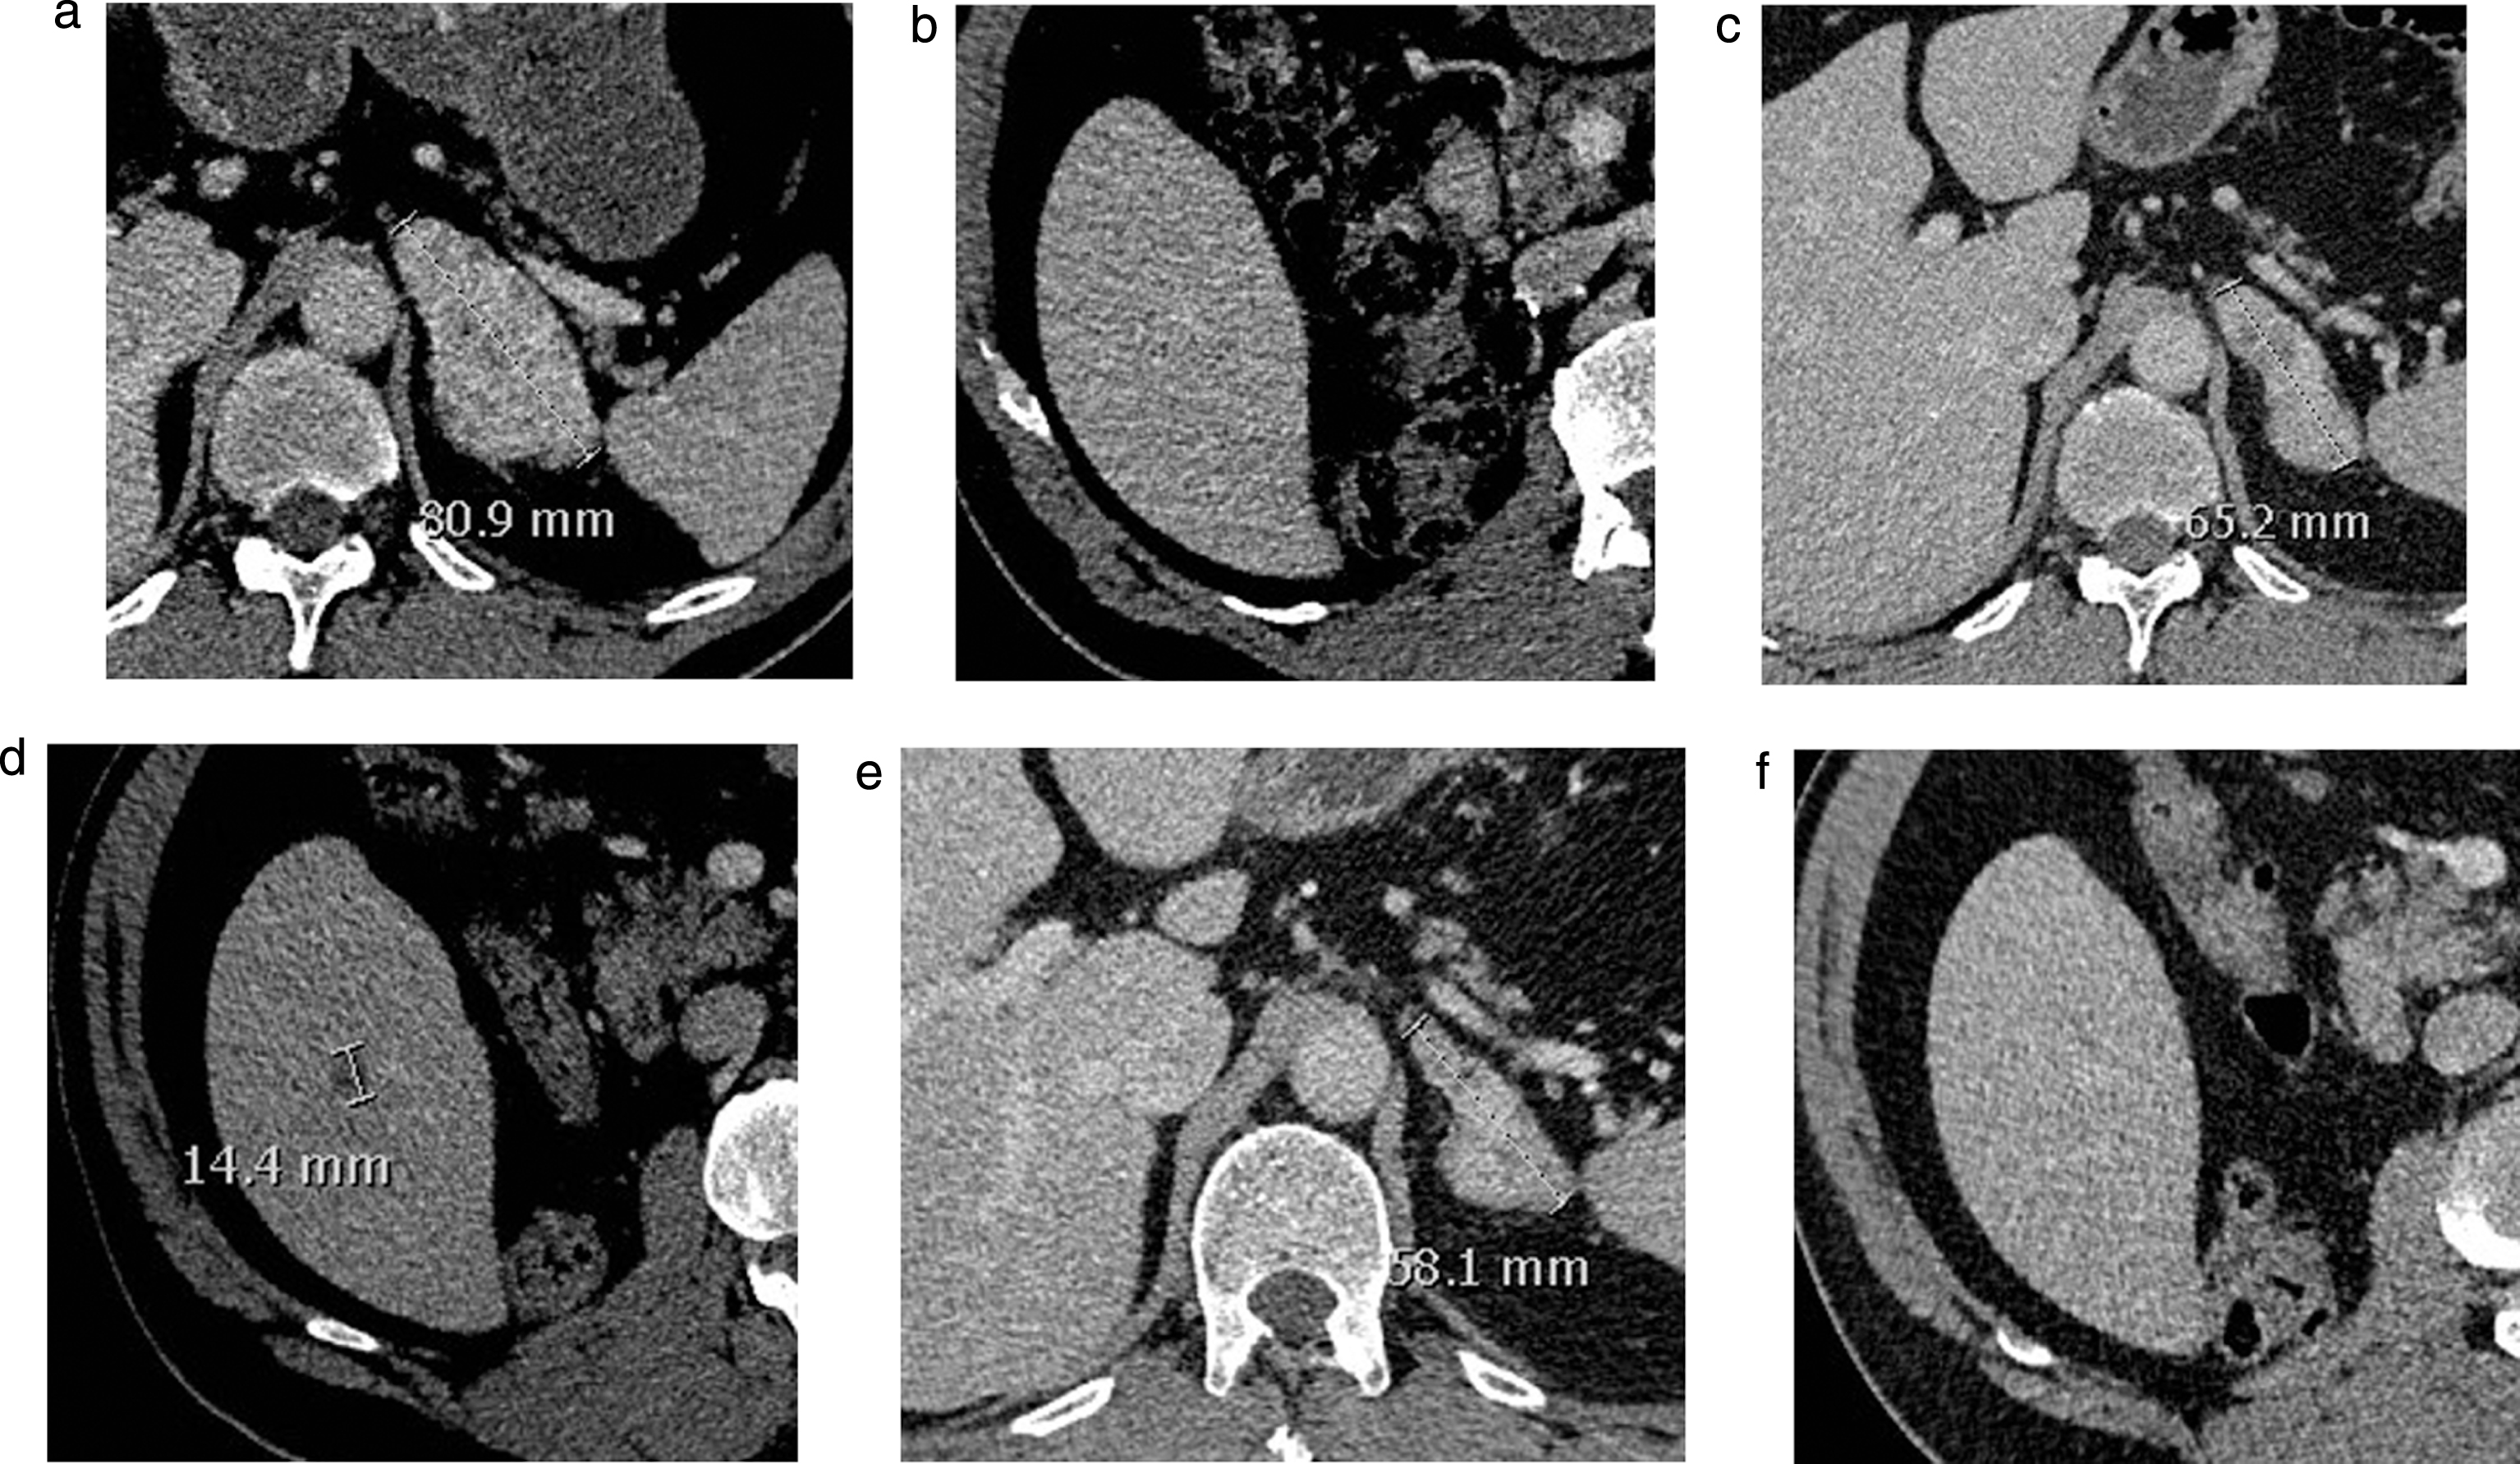
Secondly, pseudo-progressions may be observed under these therapies, first in melanoma [57], but also in mRCC [52]. These pseudo-progressions are characterised by an initial increase in tumour size under therapy or the appearance of new lesions (Fig. 4), followed by an often significant response. It is hypothesised that these pseudo-progressions are related to a massive infiltration of the tumour by immune cells reflecting a strong immune response which will result in treatment efficacy [7]. Current recommendations are to systematically confirm any observed progression after 4 more weeks of therapy if patients are clinically stable. Though it is hard to estimate without published studies, probably less than 10–15% of cases in which tumours increase in size or number of lesions are pseudo-progressions. For example, in Escudier et al. [52], 13% of mRCC patients under nivolumab treated beyond RECIST progression went on to have a partial response. Identifying patients who are truly progressing vs.pseudo-progressing is important to avoid delay before switching to an active drug. To date, no imaging criteria has shown to differentiate a pseudo-progression from a real progression. After several proposals by different teams of immune therapy-specific response criteria such as irRC [6] and irRECIST, the RECIST group established iRECIST to evaluate patients under immunotherapy [7]. These will provide standardised data which, analysed retrospectively in the future, will hopefully allow defining imaging signs suggestive of pseudo-progression vs. true progression. Other strategies which should be explored in the coming years include functional imaging such as metabolic imaging (PET) with current or new tracers, diffusion/perfusion MRI or quantification of heterogeneity. These may provide insights on biological changes underlying different imaging phenotypes, to help guide therapeutic decisions.
Fig.4
Baseline (a, b) and follow-up CT-scan at 6 months (c, d) and 8 months (e, f) showing an adrenal metastasis (respectively a, c, e) and the liver (respectively b, d, f) in a mRCC patient under nivolumab. No liver lesion was observed on the initial workup (b). A liver lesion appeared after 6 months (d) despite decrease in other lesions (c). On the following workup, the lesion had disappeared, while observing further response of the other lesions. This represents an example of pseudo-progression. The patient went on to respond for 7 months under therapy.
CONCLUSION
Therapeutic management of metastatic renal cell carcinoma has radically changed in the past 10–15 years. Though there has been extensive research on imaging for monitoring drug efficacy, morphological evaluation of size on CT-scan remains the standard of care. There is cumulative evidence that a –10% threshold is more predictive of tumour response and overall survival rather than the RECIST threshold of –30%. Future challenges imagers are facing however are not the evaluation of tumour response, but rather to help guide the decision to change therapy when patients are progressing. The development of new therapeutic classes such as immune oncology drugs is also generating new questions, mainly how to select patients which may respond to these therapies, and how to differentiate pseudo-progressions from true progressions.
REFERENCES
[1] | Miller AB , et al., Reporting results of cancer treatment. Cancer (1981) ;47: (1):207–14. |
[2] | Eisenhauer EA , et al., New response evaluation criteria in solid tumours: Revised RECIST guideline (version 1.1). Eur J Cancer (2009) ;45: (2):228–47. |
[3] | Therasse P , et al., New guidelines to evaluate the response to treatment in solid tumors. European Organization for Research and Treatment of Cancer, National Cancer Institute of the United States, National Cancer Institute of Canada. J Natl Cancer Inst (2000) ;92: (3):205–16. |
[4] | Escudier B , et al., Renal cell carcinoma: ESMO Clinical Practice Guidelines for diagnosis, treatment and follow-up. Ann Oncol (2012) ;23: (Suppl 7):vii65–71. |
[5] | Oudard S , Elaidi RT . Sequential therapy with targeted agents in patients with advanced renal cell carcinoma: Optimizing patient benefit. Cancer Treat Rev (2012) ;38: (8):981–7. |
[6] | Wolchok JD , et al., Guidelines for the evaluation of immune therapy activity in solid tumors: Immune-related response criteria. Clin Cancer Res (2009) ;15: (23):7412–20. |
[7] | Seymour L , et al., iRECIST: Guidelines for response criteria for use in trials testing immunotherapeutics. Lancet Oncol (2017) ;18: (3):e143–e152. |
[8] | Grunwald V , et al., Depth of remission is a prognostic factor for survival in patients with metastatic renal cell carcinoma. Eur Urol (2015) ;67: (5):952–8. |
[9] | Krajewski KM , et al., Comparison of four early posttherapy imaging changes (EPTIC; RECIST 1.0, tumor shrinkage, computed tomography tumor density, Choi criteria) in assessing outcome to vascular endothelial growth factor-targeted therapy in patients with advanced renal cell carcinoma. Eur Urol (2011) ;59: (5):856–62. |
[10] | Lamuraglia M , et al., mTOR-inhibitor treatment of metastatic renal cell carcinoma: Contribution of Choi and modified Choi criteria assessed in 2D or 3D to evaluate tumor response. Eur Radiol (2016) ;26: (1):278–85. |
[11] | Oudard S , et al., Optimisation of the tumour response threshold in patients treated with everolimus for metastatic renal cell carcinoma: Analysis of response and progression-free survival in the RECORD-1 study. Eur J Cancer (2012) ;48: (10):1512–8. |
[12] | Thiam R , et al., Optimizing the size variation threshold for the CT evaluation of response in metastatic renal cell carcinoma treated with sunitinib. Ann Oncol (2010) ;21: (5):936–41. |
[13] | Krajewski KM , et al., 10% Tumor diameter shrinkage on the first follow-up computed tomography predicts clinical outcome in patients with advanced renal cell carcinoma treated with angiogenesis inhibitors: A follow-up validation study. Oncologist (2014) ;19: (5):507–14. |
[14] | Krajewski KM , et al., Intraobserver and interobserver variability in computed tomography size and attenuation measurements in patients with renal cell carcinoma receiving antiangiogenic therapy: Implications for alternative response criteria. Cancer (2014) ;120: (5):711–21. |
[15] | Abel EJ , et al., Primary tumor response to targeted agents in patients with metastatic renal cell carcinoma. Eur Urol (2011) ;59: (1):10–5. |
[16] | Basappa NS , et al., The impact of tumor burden characteristics in patients with metastatic renal cell carcinoma treated with sunitinib. Cancer (2011) ;117: (6):1183–9. |
[17] | Ferte C , et al., Tumor growth rate provides useful information to evaluate sorafenib and everolimus treatment in metastatic renal cell carcinoma patients: An integrated analysis of the TARGET and RECORD phase 3 trial data. Eur Urol (2014) ;65: (4):713–20. |
[18] | Iacovelli R , et al., Tumour burden is an independent prognostic factor in metastatic renal cell carcinoma. BJU Int (2012) ;110: (11):1747–53. |
[19] | Stein A , et al., Survival prediction in everolimus-treated patients with metastatic renal cell carcinoma incorporating tumor burden response in the RECORD-1 trial. Eur Urol (2013) ;64: (6):994–1002. |
[20] | Stein WD , et al., Other paradigms: Growth rate constants and tumor burden determined using computed tomography data correlate strongly with the overall survival of patients with renal cell carcinoma. Cancer J (2009) ;15: (5):441–7. |
[21] | Choi H , et al., Correlation of computed tomography and positron emission tomography in patients with metastatic gastrointestinal stromal tumor treated at a single institution with imatinib mesylate: Proposal of new computed tomography response criteria. J Clin Oncol (2007) ;25: (13):1753–9. |
[22] | Hittinger M , et al., Course of size and density of metastatic renal cell carcinoma lesions in the early follow-up of molecular targeted therapy. Urol Oncol (2012) ;30: (5):695–703. |
[23] | Nathan PD , et al., CT response assessment combining reduction in both size and arterial phase density correlates with time to progression in metastatic renal cancer patients treated with targeted therapies. Cancer Biol Ther (2010) ;9: (1):15–9. |
[24] | Schmidt N , et al., Choi response criteria for prediction of survival in patients with metastatic renal cell carcinoma treated with anti-angiogenic therapies. Eur Radiol (2013) ;23: (3):632–9. |
[25] | Thian Y , et al., Revised Choi imaging criteria correlate with clinical outcomes in patients with metastatic renal cell carcinoma treated with sunitinib. Radiology (2014) ;273: (2):452–61. |
[26] | van der Veldt AA , et al., Choi response criteria for early prediction of clinical outcome in patients with metastatic renal cell cancer treated with sunitinib. Br J Cancer (2010) ;102: (5):803–9. |
[27] | Smith AD , Lieber ML , Shah SN . Assessing tumor response and detecting recurrence in metastatic renal cell carcinoma on targeted therapy: Importance of size and attenuation on contrast-enhanced CT. AJR Am J Roentgenol (2010) ;194: (1):157–65. |
[28] | Smith AD , et al., Morphology, Attenuation, Size, and Structure (MASS) criteria: Assessing response and predicting clinical outcome in metastatic renal cell carcinoma on antiangiogenic targeted therapy. AJR Am J Roentgenol (2010) ;194: (6):1470–8. |
[29] | Smith AD , et al., Utilizing pre-therapy clinical schema and initial CT changes to predict progression-free survival in patients with metastatic renal cell carcinoma on VEGF-targeted therapy: A preliminary analysis. Urol Oncol (2013) ;31: (7):1283–91. |
[30] | Alic L , Niessen WJ , Veenland JF . Quantification of heterogeneity as a biomarker in tumor imaging: A systematic review. PLoS One (2014) ;9: (10):e110300. |
[31] | Goh V , et al., Assessment of response to tyrosine kinase inhibitors in metastatic renal cell cancer: CT texture as a predictive biomarker. Radiology (2011) ;261: (1):165–71. |
[32] | Haider MA , et al., CT texture analysis: A potential tool for prediction of survival in patients with metastatic clear cell carcinoma treated with sunitinib. Cancer Imaging (2017) ;17: (1):4. |
[33] | Lambin P , et al., Radiomics: Extracting more information from medical images using advanced feature analysis. Eur J Cancer (2012) ;48: (4):441–6. |
[34] | Kumar V , et al., Radiomics: The process and the challenges. Magn Reson Imaging (2012) ;30: (9):1234–48. |
[35] | Larue RT , et al., Quantitative radiomics studies for tissue characterization: A review of technology and methodological procedures. Br J Radiol (2017) ;90: (1070):20160665. |
[36] | Bex A , et al., Assessing the response to targeted therapies in renal cell carcinoma: Technical insights and practical considerations. Eur Urol (2014) ;65: (4):766–77. |
[37] | Lamuraglia M , et al., To predict progression-free survival and overall survival in metastatic renal cancer treated with sorafenib: Pilot study using dynamic contrast-enhanced Doppler ultrasound. Eur J Cancer (2006) ;42: (15):2472–9. |
[38] | Lassau N , et al., Validation of dynamic contrast-enhanced ultrasound in predicting outcomes of antiangiogenic therapy for solid tumors: The French multicenter support for innovative and expensive techniques study. Invest Radiol (2014) ;49: (12):794–800. |
[39] | Fournier LS , et al., Metastatic renal carcinoma: Evaluation of antiangiogenic therapy with dynamic contrast-enhanced CT. Radiology (2010) ;256: (2):511–8. |
[40] | de Bazelaire C , et al., Magnetic resonance imaging-measured blood flow change after antiangiogenic therapy with PTK787/ZK 222584 correlates with clinical outcome in metastatic renal cell carcinoma. Clin Cancer Res (2008) ;14: (17):5548–54. |
[41] | Hahn OM , et al., Dynamic contrast-enhanced magnetic resonance imaging pharmacodynamic biomarker study of sorafenib in metastatic renal carcinoma. J Clin Oncol (2008) ;26: (28):4572–8. |
[42] | Panebianco V , et al., Dynamic contrast-enhanced magnetic resonance imaging in the early evaluation of anti-angiogenic therapy in metastatic renal cell carcinoma. Anticancer Res (2013) ;33: (12):5663–6. |
[43] | Kayani I , et al., Sequential FDG-PET/CT as a biomarker of response to Sunitinib in metastatic clear cell renal cancer. Clin Cancer Res (2011) ;17: (18):6021–8. |
[44] | Nakaigawa N , et al., FDG PET/CT as a prognostic biomarker in the era of molecular-targeting therapies: Max SUVmax predicts survival of patients with advanced renal cell carcinoma. BMC Cancer (2016) ;16: :67. |
[45] | Yamasaki T , et al., Exploring a glycolytic inhibitor for the treatment of an FH-deficient type-2 papillary RCC. Nat Rev Urol (2011) ;8: (3):165–71. |
[46] | Hugonnet F , et al., Metastatic renal cell carcinoma: Relationship between initial metastasis hypoxia, change after 1 month’s sunitinib, and therapeutic response: An 18F-fluoromisonidazole PET/CT study. J Nucl Med (2011) ;52: (7):1048–55. |
[47] | Choueiri TK , et al., Carbonic anhydrase IX as a potential biomarker of efficacy in metastatic clear-cell renal cell carcinoma patients receiving sorafenib or placebo: Analysis from the treatment approaches in renal cancer global evaluation trial (TARGET). Urol Oncol (2013) ;31: (8):1788–93. |
[48] | Muselaers CH , et al., Tyrosine kinase inhibitor sorafenib decreases 111In-girentuximab uptake in patients with clear cell renal cell carcinoma. J Nucl Med (2014) ;55: (2):242–7. |
[49] | Jahangiri A , Aghi MK . Biomarkers predicting tumor response and evasion to anti-angiogenic therapy. Biochim Biophys Acta (2012) ;1825: (1):86–100. |
[50] | Burotto M , et al., Continuing a cancer treatment despite tumor growth may be valuable: Sunitinib in renal cell carcinoma as example. PLoS One (2014) ;9: (5):e96316. |
[51] | de Velasco G , et al., Optimizing systemic therapy for metastatic renal cell carcinoma beyond the first-line setting. Urol Oncol (2015) ;33: (12):538–45. |
[52] | Escudier B , et al., Treatment Beyond Progression in Patients with Advanced Renal Cell Carcinoma Treated with Nivolumab in CheckMate 025. Eur Urol (2017) . |
[53] | Plimack ER , et al., Patterns of disease progression in metastatic renal cell carcinoma patients treated with antivascular agents and interferon: Impact of therapy on recurrence patterns and outcome measures. Cancer (2009) ;115: (9):1859–66. |
[54] | Ascierto PA , Daniele B , Hammers H , Hirsh V , Kim J , Licitra L , Nanda R , Pignata S . Perspectives in immunotherapy: Meeting report from the “Immunotherapy Bridge”, Napoli, November 30th 2016. J Transl Med (2017) ;15: (1):205. |
[55] | Mennitto A , et al., Nivolumab in the treatment of advanced renal cell carcinoma: Clinical trial evidence and experience. Ther Adv Urol (2016) ;8: (5):319–26. |
[56] | Maughan BL , et al., Incidence of Immune-Related Adverse Events with Program Death Receptor-1- and Program Death Receptor-1 Ligand-Directed Therapies in Genitourinary Cancers. Front Oncol (2017) ;7: :56. |
[57] | Chiou VL , Burotto M . Pseudoprogression and immune-related response in solid tumors. J Clin Oncol (2015) ;33: (31):3541–3. |

