
Kidney Cancer Incidence in California: End of the Trend?
Abstract
Background and Objective: Since the 1990s, multiple studies have reported on an increased incidence of renal cell carcinomas (RCC), which has been considered incidental to the high use of abdominal diagnostic imaging. This population-based study used data from the California Cancer Registry to (i) update trends in RCC incidence and mortality by several tumor and demographic characteristics after reports of decreased use of diagnostic imaging in recent years, and (ii) examine changes in surgical treatment for early-stage RCC.
Methods: Records of patients diagnosed with RCC from 1988 through 2013 and mortality data from the same period were examined. Joinpoint regression was used to estimate annual percent changes in age-adjusted RCC incidence and mortality rates, stratified by sex, race/ethnicity, stage at diagnosis, grade, and tumor size. Trends in the proportion of partial or total/radical nephrectomies were evaluated by Cochran-Armitage tests.
Results: A total of 77,363 incident cases of RCC and 28,590 deaths were evaluated. While mortality rates significantly decreased, the incidence of small localized RCC increased in virtually all groups examined after the mid-1990s until 2008-2009, when incidence trends stabilized in all groups concomitant with a decrease in imaging. The proportion of partial nephrectomies among patients with small localized tumors increased from 13.8% in 1988 to 74.6% in 2013.
Conclusions: Earlier trends in RCC were consistent with the incidental discovery of small tumors. In parallel with the increase in early-stage RCC, the use of partial nephrectomies increased markedly. Following the decreased use of advanced diagnostic imaging, the trend of increasing RCC incidence appears to have ended in California.
INTRODUCTION
Kidney cancer is the eighth most commonly diagnosed cancer in California. In 2013, there were 5,678 new cases of kidney cancer in the state and 1,350 deaths due to the disease [1]. The great majority of cancers originating in the kidney parenchyma are renal cell carcinomas (RCC), for which established risk factors include obesity, tobacco use and hypertension [2–7]. RCC is twice as likely to be diagnosed among males [8].
Multiple studies have reported an increased incidence of kidney cancer, and specifically renal cell carcinoma (RCC), over the past 20 years in the US [9–15]. The increase in incidence has been largely considered incidental to the increased use of abdominal diagnostic imaging to evaluate unrelated conditions [16–21]. A study assessing the use of imaging in the US between 1996 and 2010 found that the use of ultrasound doubled, computed tomography (CT) tripled, magnetic resonance imaging (MRI) quadrupled and positron emission tomography (PET) scans increased tenfold after 2004 [20]. An earlier study, based on data from private insurers in California, reported 50 percent increased use of MRI and CT and 400 percent increased use of PET scans between 2000 and 2004 [22].
Advanced diagnostic imaging has the potential to detect tumors before they become symptomatic. A previous case-series comparing symptomatic to non-symptomatic kidney cancers found that 61% of cases were incidentally-discovered tumors [16]. However, there is now evidence that the increased use of advanced imaging utilization has slowed in outpatient settings in recent years, [23] although not necessarily in hospital emergency departments [24]. A recent analysis by King et al. using combined data from the Surveillance, Epidemiology and End Results (SEER) and from the National Program of Cancer Registries from 2001-2010, found that not all incidentally diagnosed tumors are indolent, as the highest increase in RCC incidence was detected in grade III disease [11]. This finding suggests that other factors may be contributing to the increased incidence of RCC.
During the past decade, partial nephrectomies have been recommended as a safe alternative to radical nephrectomies as a way of preserving long term renal function, and is considered as the preferred primary treatment for patients with T1a tumors by the National Comprehensive Cancer Network guidelines (https://www.nccn.org/professionals/physician_gls/pdf/kidney.pdf). However, a publication in 2011 of clinical trial data has generated new controversy regarding the comparative benefits of partial versus radical nephrectomies [25]. Because a rise in the incidence of RCC results in an increased number of surgeries, it is important to examine how patients diagnosed with early stage RCC have been managed.
In this study we sought to (i) update information on trends in RCC incidence and mortality by several tumor and patient demographic characteristics in light of the reported decrease in diagnostic imaging, and (ii) examine potential changes in surgical treatment for early-stage RCC in California. The large and highly diverse population in California allows for granular analyses of RCC trends and likely reasons for the increased incidence of RCC, as well as the temporal changes in surgical treatment of early-stage RCC.
METHODS
Sources of data
The study was conducted using California Cancer Registry (CCR) records of patients having pathologically confirmed kidney cancer from 1988 through 2013. The CCR is California’s population-based cancer surveillance system; it has collected statewide data on tumor characteristics, diagnosis, treatment, follow-up, and patient demographic information for incident cancers diagnosed since 1988. Data are collected through a network of regional registries, which are also affiliated with the National Cancer Institute’s SEER program.
Tumor site and histology were coded according to the World Health Organization International Classification of Diseases for Oncology (ICD-O, third edition) [26]. Kidney tumors with histologic codes 8260, 8310, 8312, and 8316–8318 were classified as RCC. Tumor grade, or degree of cellular differentiation was classified as well (I), moderately (II), and poorly/not differentiated (III/IV). Stage of disease at diagnosis was coded according to SEER Summary Staging rules [27]. Based on this staging system, an invasive tumor is classified as localized when confined entirely to its organ of origin. Regional tumors extend beyond the organ of origin, either into regional lymph nodes or by direct contact with nearby organs or tissues. Distant tumors have metastasized to other parts of the body at the time of diagnosis. Tumor stage was considered unknown if the information available was not sufficient to assign a stage.
Tumor size in its greatest dimension was coded in centimeters and categorized as ≤ 4 cm, 4.1–7.0 cm, 7.1–10.0 cm and >10 cm. These size categories correspond to those in the current American Joint Committee on Cancer TNM system [28] T component classification for localized kidney tumors: T1a (≤ 4 cm), T1b (4.1–7.0 cm), T2a (7.1–10.0 cm) and T2b (>10 cm).
Race/ethnicity was coded according to the North American Association of Central Cancer Registries’ Hispanic and Asian/Pacific Islander Identification Algorithm (NHAPIIA) [29]. Age at diagnosis was grouped as 20–44, 45–54, 55–64, 65–74, and 75+ to provide more granular information.
An area-based socioeconomic status (SES) composite index, [30, 31] categorized in quintiles, was used to represent SES in the patient’s neighborhood. This index was created through principal component analysis and includes the following census variables: proportion with a blue-collar job, proportion older than 16 years in the workforce without a job, median household income, percent below 200% poverty level, median gross rent, median value of owner-occupied houses, and an education index.
Type of surgery was classified based on codes from the American College of Surgeons’ Commission on Cancer Facility Oncology Registry Data Standards (FORDS) [32]. Surgery codes 10 through 30 (including local tumor destruction, local tumor excision, partial or subtotal nephrectomy such as segmental and wedge resection) were classified as excision/partial nephrectomy; codes 40–50 (complete, simple, total or radical nephrectomy) were classified as total/radical nephrectomy; codes 60–90 (any nephrectomy in continuity with the resection of other organ(s), nephrectomy or surgery, not specified) were classified as surgery not otherwise specified (NOS).
Mortality data files for kidney cancer were obtained through the California Department of Public Health, Center for Health Statistics and Informatics. Rates were calculated for kidney cancer deaths regardless of histologic type, which is not specified in the death certificate.
Statistical analysis
Frequency distributions of patient demographics (age at diagnosis, race/ethnicity and neighborhood SES) and tumor-related characteristics (histology, laterality, tumor size, and stage at diagnosis) were obtained for all incident cases of RCC. The SAS System release 9.3 (SAS Institute Inc., Cary, North Carolina) was used to obtain mean, median, and proportions for all study variables. The Cochran-Armitage Test was used to evaluate the statistical significance of trends in proportions, with a significance threshold of 0.05. The Surveillance Research Program, National Cancer Institute SEER*Stat software version 8.2.1 (www.seer.cancer.gov/seerstat) was used to calculate incidence and mortality rates age-adjusted to the 2000 U.S. standard population. Age-adjusted incidence and mortality rates were stratified by sex, race/ethnicity, and age; incidence rates were also stratified by stage at diagnosis, tumor size (as they would be currently classified), tumor grade and SES level.
Trend analyses were performed using the Joinpoint Regression Program, Version 4.2.0 –April 2015; Statistical Methodology and Applications Branch, Surveillance Research Program, National Cancer Institute (http://surveillance.cancer.gov/joinpoint/). Joinpoint linear regression is a method that describes complex temporal trends by detecting “joinpoints”, or points in time where the slope of the regression line significantly changes [33]. At each line segment, or time period, trends in incidence and mortality rates were measured using the estimated annual percent change (APC). All statistical tests had a significance threshold of 0.05.
RESULTS
Incidence
A total of 86,650 kidney cancer cases were diagnosed in California from 1988 through 2013. Of these, 77,363 (89.3%) were histologically confirmed as RCC and 9,287 (10.7%) as other tissue types (including 1,277 cases classified as malignant neoplasm but not histologically confirmed). Frequency distributions for all study variables for RCC cases are shown in Table 1. Of all RCCs with a specified histologic subtype (40,988), 32,501 (79.3%) were clear cell carcinomas, 4,914 (12.0%) were papillary carcinomas, and 2,448 (6.0%) were of the chromophobe type. Histologic subtype was not otherwise specified in 36,375 (47.0%) cases. The majority of cases were diagnosed in males (63.9%), and at localized stage of disease (61.5%). Stage was not documented in 4.3% of cases. The majority of tumors (97.7%) were unilateral, 0.3% were bilateral, and tumor laterality was not documented in 2.0 percent of cases. Almost half of RCC cases (49.1%) were diagnosed in patients 65 years of age and older. From 1988 through 2013, mean tumor size for RCC decreased from 7.0 cm to 5.4 cm.
Table 1
Characteristics of 77,363 Renal Cell Carcinoma (RCC) Cases Diagnosed in California, 1988–2013
| Characteristic | N | % | |
| Sex | Male | 49,538 | 64.0 |
| Female | 27,825 | 36.0 | |
| Race/Ethnicity | White non-Hispanic | 49,169 | 63.6 |
| African American | 5,646 | 7.3 | |
| Hispanic | 16,687 | 21.6 | |
| Asian/Pacific Islander | 5,030 | 6.5 | |
| Other/Unknown | 831 | 1.1 | |
| Age at Diagnosis | 20–44 | 6,437 | 8.3 |
| 45–54 | 13,031 | 16.8 | |
| 55–64 | 19,912 | 25.7 | |
| 65–74 | 20,887 | 27.0 | |
| 75 + | 17,096 | 22.1 | |
| Median Age (years) | 65 (1988)–64 (2013) | ||
| Stage at Diagnosis | Localized | 47,992 | 62.0 |
| Regional | 12,538 | 16.2 | |
| Distant | 13,521 | 17.5 | |
| Unknown | 3,312 | 4.3 | |
| Histologic Type | Clear Cell | 32,501 | 42.0 |
| Papillary | 4,914 | 6.3 | |
| RCC, not otherwise specified | 36,375 | 47.0 | |
| Chromophobe | 2,448 | 3.2 | |
| Sarcomatoid (spindle cell) | 841 | 1.1 | |
| Cyst-Associated | 311 | 0.4 | |
| Tumor Grade | I | 8,113 | 10.5 |
| II | 24,538 | 31.7 | |
| III/IV | 16,141 | 20.9 | |
| Unknown | 28,571 | 36.9 | |
| Mean Tumor Size (cm) | 7.0 (1988)–5.4 (2013) | ||
| Tumor size (cm) | 0.1–4.0 | 27,752 | 35.9 |
| 4.1–7.0 | 21,462 | 27.7 | |
| 7.1–10.0 | 11,915 | 15.4 | |
| >10.0 | 8,351 | 10.8 | |
| Unknown | 7,883 | 10.2 | |
| Surgical Treatment | Excision/Partial Nephrectomy | 14,152 | 18.3 |
| Total/Radical Nephrectomy | 44,705 | 57.8 | |
| Surgery, not otherwise specified | 2,166 | 2.8 | |
| No Surgery | 15,869 | 20.5 | |
| Unknown | 471 | 0.6 | |
| SES Level | 1 (lowest) | 12,083 | 15.6 |
| 2 | 14,579 | 18.8 | |
| 3 | 15,840 | 20.5 | |
| 4 | 15,825 | 20.5 | |
| 5 (highest) | 15,500 | 20.0 | |
| Missing | 3,536 | 4.6 |
Analysis of trends shows that incidence of RCC increased by about 1.5 percent per year from 1988–2000, rose steeply by about 4.8 percent per year until 2008, and then stabilized (Table 2). In contrast, incidence rates for other histologic types decreased by 3.7 percent per year from 1988–1994 (p = 0.046), increased by 3.8 percent per year until 2003 (p = 0.002) and declined thereafter by 4.2 percent per year (p < 0.001), data not shown.
Table 2
Annual Percent Change (APC) in age-adjusted incidence rates for renal cell carcinoma (RCC) and mortality rates for kidney cancera in California, 1988–2013
| Period | APC | P-value | Period | APC | P-value | Period | APC | P-value | Period | APC | P-value | Period | APC | P-value | ||
| RCC Incidence (N = 77,363) | Kidney Cancer Mortality (N = 28,590) | |||||||||||||||
| Sex | All | 1988–2000 | 1.5 | <0.001 | 2000–2008 | 4.8 | <0.001 | 2008–2013 | 0.2 | 0.688 | 1988–2013 | –0.4 | <0.001 | |||
| Males | 1988–2000 | 1.4 | <0.001 | 2000–2008 | 4.6 | <0.001 | 2008–2013 | 0.5 | 0.506 | 1988–2013 | –0.4 | <0.001 | ||||
| Females | 1988–2000 | 1.5 | <0.001 | 2000–2008 | 5.0 | <0.001 | 2008–2013 | –0.5 | 0.480 | 1988–2013 | –0.6 | <0.001 | ||||
| Age | 20–44 | 1988–1998 | 1.8 | 0.100 | 1998–2013 | 6.0 | <0.001 | 1988–2013 | –0.8 | 0.045 | ||||||
| 45–54 | 1988–1997 | –0.2 | 0.776 | 1998–2008 | 4.0 | <0.001 | 2008–2013 | 0.5 | 0.657 | 1988–2013 | –2.0 | <0.001 | ||||
| 55–64 | 1988–2009 | 2.6 | <0.001 | 2009–2013 | 0.1 | 0.933 | 1988–1996 | 0.7 | 0.522 | 1996–2013 | –2.0 | <0.001 | ||||
| 65–74 | 1988–2000 | 1.6 | 0.001 | 2000–2008 | 5.3 | <0.001 | 2008–2013 | 0.2 | 0.829 | 1988–2013 | –0.6 | <0.001 | ||||
| ≥75 | 1988–1995 | 0.5 | 0.716 | 1995–2009 | 4.0 | <0.001 | 2009–2013 | –2.0 | 0.323 | 1988–2013 | 0.7 | <0.001 | ||||
| Race/Ethnicity | White NH | 1988–2000 | 1.7 | <0.001 | 2000–2009 | 4.4 | <0.001 | 2009–2013 | –0.6 | 0.542 | 1988–2013 | –0.5 | <0.001 | |||
| African American | 1988–2009 | 3.4 | <0.001 | 2009–2013 | 0.5 | 0.866 | 1988–2013 | –0.4 | 0.333 | |||||||
| Hispanic | 1988–2000 | 1.9 | <0.001 | 2000–2008 | 5.0 | <0.001 | 2008–2013 | –0.1 | 0.945 | 1988–1999 | 2.0 | 0.025 | 1999–2013 | –1.1 | 0.016 | |
| API | 1988–2004 | 1.8 | 0.002 | 2004–2007 | 12.0 | 0.161 | 2007–2013 | 0.1 | 0.905 | 1988–2013 | 1.1 | 0.016 | ||||
| Tumor size (cm) | 0.1–4.0 | 1988–1999 | 6.0 | <0.001 | 1999–2009 | 8.8 | <0.001 | 2009–2013 | –0.3 | 0.787 | ||||||
| 4.1–7.0 | 1988–1992 | 7.9 | 0.002 | 1992–2009 | 2.9 | <0.001 | 2009–2013 | –0.1 | 0.912 | |||||||
| 7.1–10.0 | 1988–1998 | 5.4 | <0.001 | 1998–2013 | 0.8 | 0.057 | ||||||||||
| >10 cm | 1988–1998 | 5.0 | <0.001 | 1998–2013 | 0.8 | 0.022 | ||||||||||
| Unknown | 1988–1991 | –3.5 | 0.329 | 1991–1994 | –21.9 | 0.010 | 1994–2013 | –4.1 | <0.001 | |||||||
| Stage at Diagnosis | Localized | 1988–2000 | 3.1 | <0.001 | 2000–2008 | 7.6 | <0.001 | 2008–2013 | 0.3 | 0.586 | ||||||
| Regional | 1988–1996 | –0.7 | 0.318 | 1996–2013 | 1.0 | <0.001 | ||||||||||
| Distant | 1988–1913 | –0.0 | 0.927 | |||||||||||||
| Unknown | 1988–1913 | –2.1 | <0.001 | |||||||||||||
| Tumor Gradeb | I | 1988–1991 | 12.4 | 0.097 | 1991–2009 | 1.5 | <0.001 | 2009–2013 | –6.7 | 0.029 | ||||||
| II | 1988–1992 | 14.9 | 0.002 | 1992–2009 | 7.2 | <0.001 | 2009–2013 | –3.7 | 0.025 | |||||||
| III/IV | 1988–2008 | 8.1 | <0.001 | 2008–2013 | –1.5 | 0.301 | ||||||||||
| Unknown | 1988–1997 | –4.1 | <0.001 | 1997–2009 | –0.4 | 0.538 | 2009–2013 | 7.7 | 0.006 | |||||||
| SES (localized RCC) | 1 (lowest) | 1988–2004 | 3.5 | <0.001 | 2004–2008 | 13.5 | 0.003 | 2008–2013 | –0.3 | 0.814 | ||||||
| 2 | 1988–2001 | 2.7 | <0.001 | 2001–2008 | 8.7 | <0.001 | 2008–2013 | 0.2 | 0.820 | |||||||
| 3 | 1988–1996 | 2.0 | 0.116 | 1996–2008 | 6.2 | <0.001 | 2008–2013 | 1.5 | 0.271 | |||||||
| 4 | 1988–2000 | 3.5 | <0.001 | 2000–2008 | 7.4 | <0.001 | 2008–2013 | 0.3 | 0.774 | |||||||
| 5 (highest) | 1988–1998 | 2.6 | 0.003 | 1998–2008 | 6.8 | <0.001 | 2008–2013 | –0.9 | 0.440 | |||||||
aICD-9 and ICD-10 codes renal cell carcinoma and kidney cancer as a single cause of death. NH = Non-Hispanic, API = Asian/Pacific Islander.
While RCC incidence rates were substantially lower among females than in males, patterns in trends were similar for both sexes (Table 2). From 1988 through 2000, incidence rates increased by 1.4 percent per year among males and by 1.5 percent per year for females, followed by a marked increase in rates between 2000 and 2008-2009 (APC = 4.6% and 5.0% for males and females, respectively, both with p < 0.001). However, incidence rates reached a plateau after 2008, and no further increases in rates were seen (APC = 0.5%, p-value = 0.500 for males and APC = –0.5%, p-value = 0.480 for females) (Fig. 1a). Incidence rates increased in all age groups, particularly from the mid to late 1990 s (Table 2). However, with the exception of rates among the 20–44 years age group (for whom the incidence of RCC continued to significantly increase through 2013), trends reversed and RCC incidence stabilized in 2008 and 2009 (Fig. 1b).
Fig.1
(a–f) Trends in age-adjusted incidence rates of renal cell carcinoma in California, 1988–2013 Markers: actual age-adjusted rates, lines: regression-estimated rates.
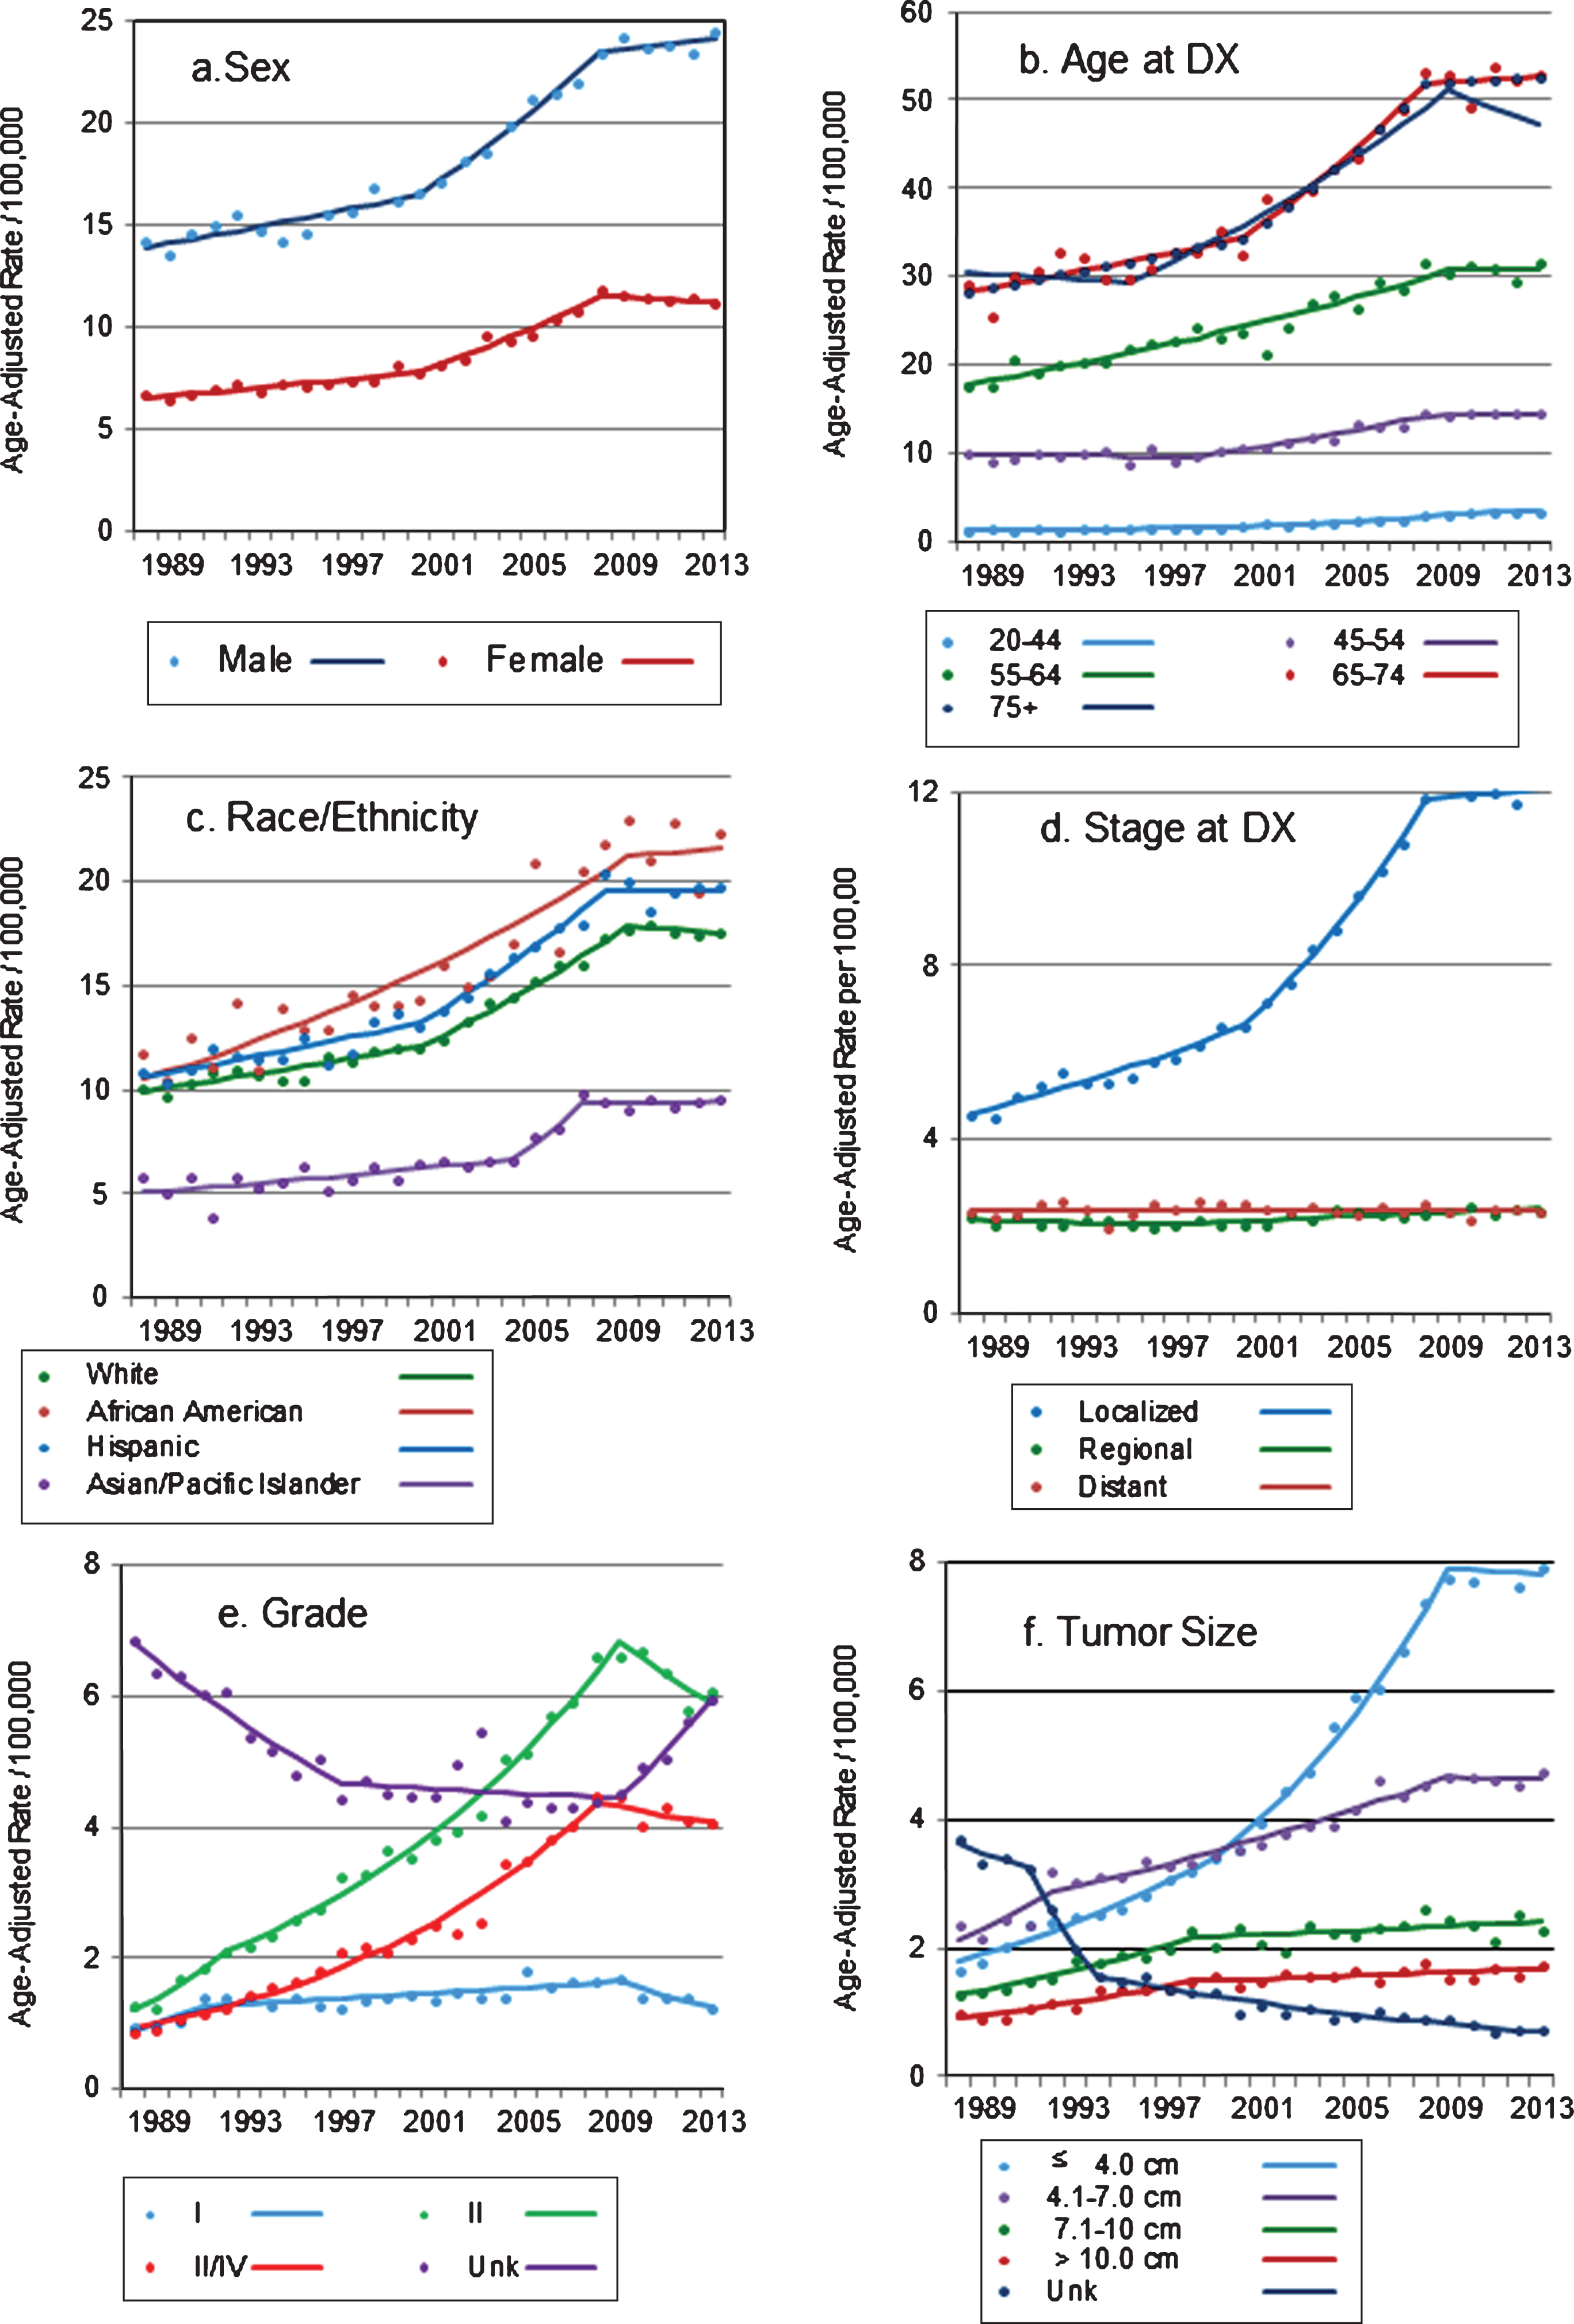
Similar to what was described for trends by age group, incidence rates of RCC increased significantly and markedly in all racial/ethnic groups examined, but only until 2007–2009 (Fig. 1c). Incidence rates among whites and Hispanics increased significantly and in a similar pattern, by 1.7 percent and 1.9 percent per year until 2000, and by 4.4 percent and 5.0 percent per year until 2008 and 2009, respectively, after which there were no significant change in rates (Table 2). Among African Americans, rates increased by 3.4 percent per year until 2009 and stabilized thereafter, while among Asian/Pacific Islanders, the increase in rates was less pronounced but the trend also stabilized after 2007.
The incidence of localized RCC (i.e., tumors confined to the kidney parenchyma) increased by 3.1 percent per year between 1988 and 2000, and by 7.6 percent per year between 2000 and 2008 (p < 0.001 for both APCs, Table 2). Consistent with trends described for other groups examined, incidence rates of localized RCC flattened after 2008 (APC = 0.3, p-value = 0.586) (Fig. 1d). This pattern held after incident localized tumors were stratified by age group and race/ethnicity (data not shown). Further analysis, restricted to localized tumors, showed that the proportion of T1a tumors increased from 35 percent in 1988 to 59 percent in 2013, while the proportion of localized T1b tumors decreased from 43 percent to 28 percent during the period (data not shown).
The incidence of regional-stage tumors increased after 1996, but less so (APC = 1.0, p < 0.001, Table 2), with the increase limited to persons younger than 44 years old (APC = 1.7, p-value = 0.004) or 75 years and older (APC = 1.1, p-value <0.001). Metastatic RCC incidence did not increase during the study period (Table 2), except for patients 75 years and older, for whom the incidence of metastatic RCC increased by 0.7 percent per year until 2013 (APC = 0.69, p = 0.018, not shown). The incidence of high grade tumors (grades III-IV) increased dramatically (APC = 8.1, p-value <0.001, Table 2) but again, only until 2008, after which incidence did not change significantly (APC = –1.5, p-value 0.301) (Fig. 1e). Tumors well or moderately differentiated (grades I and II) also increased from the early 1990 s until 2009 (APC 1.5 and 7.2, respectively, both with p-value <0.001). Interestingly, grade I and II tumors were the only characteristic for which incidence declined markedly and significantly after 2009: APC = –6.7 (p-value = 0.029) and –3.7 (p-value = 0.025) for well and moderately differentiated tumors, respectively (Fig. 1e). The incidence of tumors of unknown grade, which was stable after an initial decline, increased again after 2009 (APC = 7.7, p-value = 0.006).
Among RCC tumors for which size was reported, the proportion of tumors ≤ 4.0 cm increased substantially, from 26.3 percent in 1988 to 47.5 percent in 2013, while the proportion of tumors 4.1–7.0 cm decreased from 37.7 percent to 28.3 percent during the period. This relative shift towards detection of smaller tumors was mostly due to an increase in the incidence of tumors ≤ 4.0 cm, by 6.0 percent per year between 1988 and 1999 and by 8.8 percent per year from 1999 through 2009 (Table 2, p-values for both APCs <0.001). The incidence of tumors with size 4.1–7.0 cm increased as well, but less markedly (APC = 2.9, p-value<0.001 between 1992–2009). After 2009, incidence rates of these two tumor size categories no longer increased (APC = –0.3 and –0.1, p-values = 0.787 and 0.912, respectively). The incidence of larger tumors increased substantially and significantly until 1998, when the increased slowed down to 0.8% per year through 2013. On the other hand, the incidence of tumors of unknown size decreased from 3.7 per 100,000 in 1988 to 0.71 in 2013 (Fig. 1f).
Incidence rates for localized RCC, the stage with the largest increase in rates, were evaluated by neighborhood SES. Results showed that although rates of localized RCC were higher in more affluent areas (data not shown), similar increases in rates of localized RCC were detected in all SES levels, particularly during the late 1990s’ and early 2000s’ (Table 2). Following the pattern described above, rates increased until 2008, and stabilized after that.
Surgical treatment
Between 1988 and 2013, a total of 61,023 (78.9%) patients with RCC were surgically treated; 15,869 (20.5%) were not surgically treated, and information regarding surgical treatment was not available for 471 (0.6%) cases (Table 1). Trends in surgical procedures used to treat localized tumors were examined. During the study period, 44,071 (91.8%) of the 47,992 patients with localized RCC were surgically treated. The percentage of surgically treated patients declined, from 96.3 percent in 1988 to 88.6 percent in 2013 (p < 0.0001, data not shown).
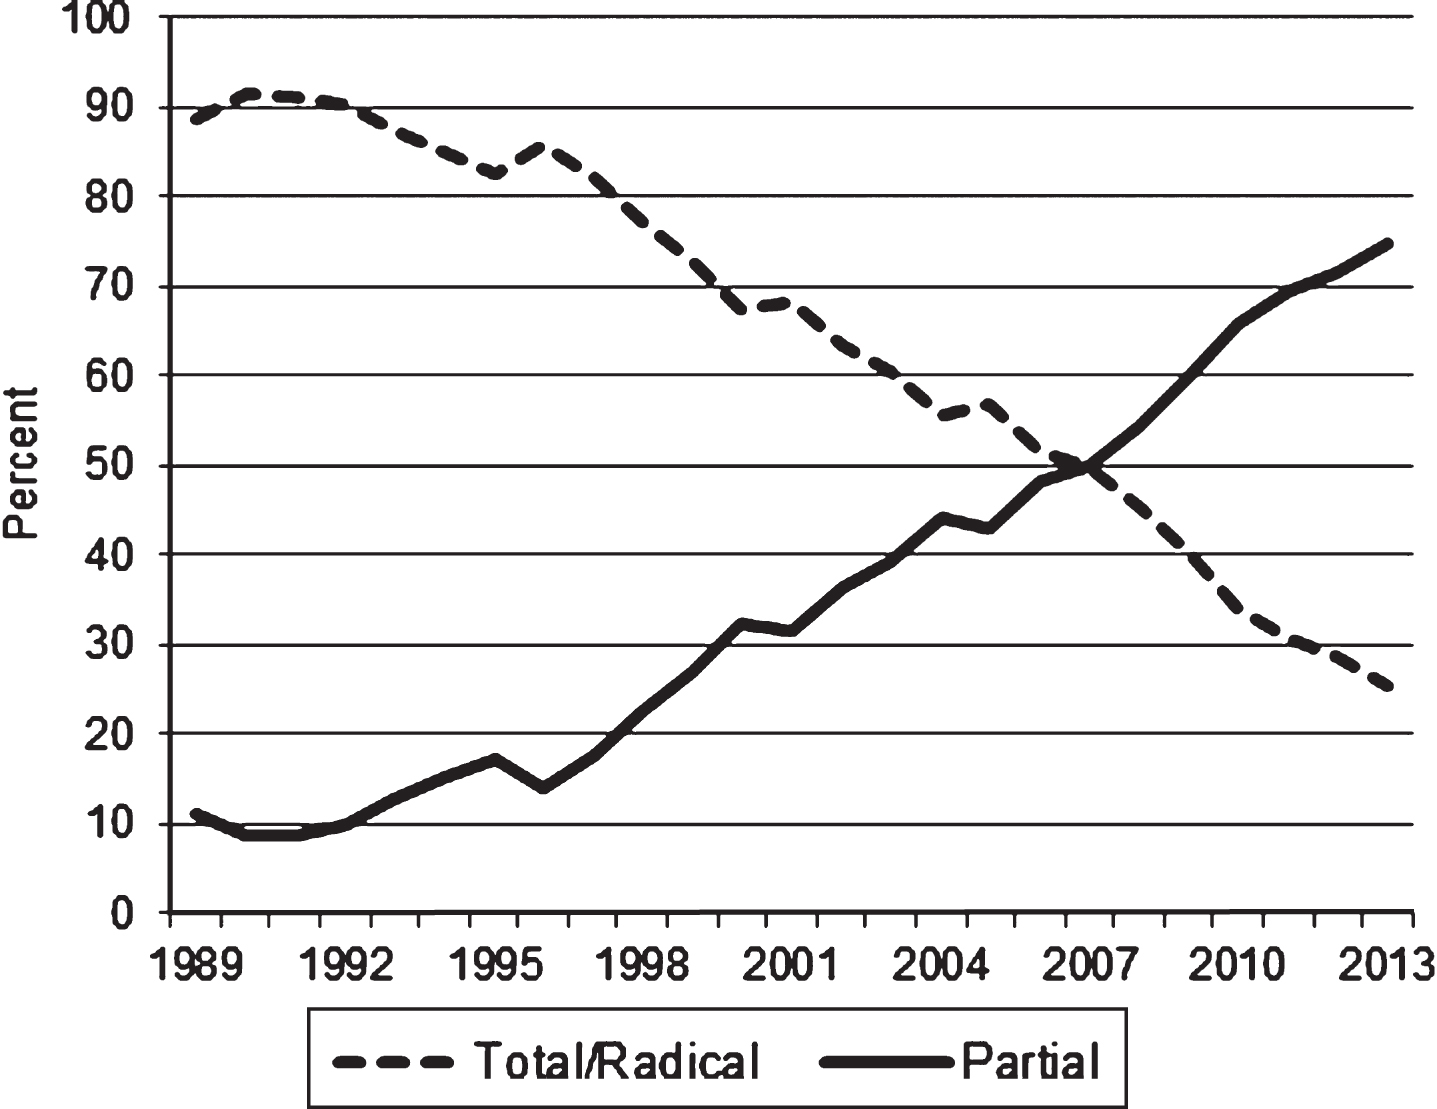
Among patients with surgically treated localized RCC (excluding those without information on the type of procedure), the proportion receiving a partial nephrectomy increased from 6.3 percent in 1988 to 56 percent in 2013 (data not shown). When tumors larger than 4 cm were excluded, the proportion of partial nephrectomies increased from 13.8 percent in 1988 to 74.6 percent in 2013 (Fig. 2), while total/radical nephrectomy in this group declined from 86.2 percent to 25.4 percent during the same period (p-value for trend <0.001).
Fig.2
Frequency (percent) of total/radical and partial nephrectomies for the treatment of localized T1aa renal cell carcinomas: California, 1988–2013. a: T1a kidney tumors are 4 cm or less in greatest dimension and limited to the kidney.
Mortality
A total of 28,590 deaths in California between 1988 and 2013 were due to kidney cancer. During that period, kidney cancer mortality rates declined significantly in both sexes –by 0.4 percent per year among males and by 0.6 percent per year among females. Decreased mortality rates were observed in both sexes and in all age groups, particularly after the mid-1990s. The only exception was among patients 75 years and older, for whom kidney cancer mortality rates increased by 0.7 percent per year (Table 2), parallel to the increase in metastatic RCC incidence in this age group.
Mortality rates among whites decreased significantly: APC = –0.5, p < 0.001; a similar but not statistically significant decrease was observed among African Americans. After an initial increase in rates, mortality among Hispanics declined by one percent per year after the late 1990s (APC = –1.1, p = 0.025). Asian/Pacific Islanders were the only group with an increase in mortality rates between 1988 and 2013 (APC = 1.1, p = 0.016), although mortality rates in this group were considerably lower than rates in other racial/ethnic groups (Table 2).
DISCUSSION
The increase in the incidence of RCC has been extensively documented, but to the best of our knowledge, this is first report of the possible end of that trend. Our study shows that the marked increase in the incidence rates of RCC in California, particularly after the late 1990s, subsided between 2007 and 2009, when incidence rates stabilized for males and females, in all age and all racial/ethnicgroups.
The increased trend in RCC incidence detected after the late 1990s in all California population subgroups examined was limited mostly to localized stage at diagnosis. That trend was driven by a significant increase in the incidence of small tumors, particularly those less than 4 cm in diameter. Incidence rates of localized RCC, which increased dramatically until 2008, took a sudden turn and levelled off through 2013, a pattern that was observed in RCC incidence trends in all demographic and tumor-related characteristics examined in this study. Despite the fact that the increase in incidence was limited to early-stage tumors, the incidence of poorly differentiated or anaplastic tumors also increased significantly. Although trends levelled off after 2008, the early increase in high grade tumors would suggest that not all incidentally detected RCCs are indolent [11].
The notable exception to the observed plateau in rates was among persons between 20 and 44 years of age, for whom incidence rates continued to significantly increase, from 1.2 per 100,000 in 1988 to 3.4 in 2013. Although the reasons for this increase are not clear, it could be hypothesized that obesity, a risk factor for many cancers, may be a contributing factor. To that effect, data from the California Health Interview Survey (http://ask.chis.ucla.edu/AskCHIS/tools/_layouts/AskChisTool/home.aspx) shows that the prevalence of obesity in this age group increased from 18.2% in 2001 to 26.4% in 2015. However, the increase in obesity during the same time period has been documented for all age groups, from 23.6% to 33.0% among adults 40 and 64 years of age and from 18.8% to 28.1% among those 65 to 79 years old. Hypertension, another risk factor for kidney cancer, has also increased over time, although not as dramatically as obesity. On the other hand, the prevalence of smoking in California has declined from 23.7% in 1988 to 11.6% in 2014 [34]. Therefore, the relationship of changes in the prevalence of these risk factors to changes in RCC incidence isunclear.
While incidence increased, kidney cancer mortality declined significantly in most population groups, particularly after the mid-1990s. Exceptions to the decline in kidney cancer mortality were observed among Asian/Pacific Islanders and persons 75 years and older, for whom mortality rates increased. Although the reasons for the increase in mortality among Asian/Pacific Islanders are not clear, the increase in mortality in elderly patients may be at least partly attributed to the increase in the incidence of metastatic disease detected in this age group. Interestingly, previous studies found an association between older age and the high and increasing utilization of diagnostic imaging [20, 23, 35]. However, as was observed in other groups, RCC incidence among patients 75 years and older stabilized and seemed to decline after 2009.
It would be reasonable to expect that incidence rates of localized disease would increase faster in patients living in more affluent areas, since they might have better access to diagnostic methods. However, this was not the case. Although rates were somewhat higher in wealthier areas, rates for localized RCC increased similarly across all SES levels.
Taken together, the increase in the incidence of small, localized tumors without a corresponding increase in kidney cancer mortality supports the hypothesis that incidence trends, until around 2009, were mostly driven by incidental findings associated with increased utilization of diagnostic imaging. As recently reported, utilization (and spending) of advanced diagnostic imaging seems to have subsided [36–38]. After the 2000 through 2005 boom in advanced medical imaging (when CT utilization grew at an annual rate of 14.3%), growth in medical imaging declined precipitously in subsequent years, from 7.1 percent in 2006 to 1.4 percent in 2009 [38]. A study comparing Medicare expenditures found that advanced imaging was among the fastest growing categories of Medicare services in the early 2000s, but was in the bottom 2 percent of spending growth categories in 2011 [36]. The drop in medical imaging was also reported for privately insured patients, for whom medical imaging actually declined by 5.4 percent from 2009 to 2010 [38].
In light of the timing described in these reports, it is possible that the levelling off or decline in RCC incidence rates observed after 2008-2009 may be at least partly due to the lower use of advanced diagnostic imaging. If many of the prevalent but asymptomatic RCC cases in the population were detected during the period when diagnostic imaging surged, then a decline in RCC incidence may be observed in the near future. Trends should be carefully assessed before drawing final conclusions.
The percentage of surgically treated cases of localized RCC has decreased in California, from 96.3 percent in 1988 to 88.6 percent in 2013. As with some other cancers detected incidentally or through screening, there is concern that at least a portion of early-detected kidney cancers are actually indolent tumors unlikely to diminish longevity, and that aggressive treatment in these cases may cause more harm than benefit [39, 40]. Furthermore, evaluating outcomes of early-diagnosed cancers can be problematic due to time biases that result in artificially inflated survival estimates. The greatest challenge in the management of patients diagnosed with small kidney tumors is distinguishing between aggressive tumors which require surgical treatment and less aggressive tumors that may be appropriately managed with active surveillance [39, 41]. This distinction is important, since not all small renal tumors are indolent, and metastatic disease can be present at the initial presentation [42]. In fact, a study of clinical and preclinical periods for RCC suggested that most renal cell carcinomas detected by imaging screening are likely to progress to clinicaldiagnosis [43].
Previous studies showed that partial nephrectomies for stage I renal cancer have increased substantially in the US, [44, 45] although they are still considered underutilized [46–48] and limited mostly to tertiary care centers [49]. Overall, the proportion of partial nephrectomies among patients diagnosed with small (≤ 4 cm) localized RCC in California increased steadily after the mid-1990s, from 13.8 percent in 1988 to 74.6 percent in 2013. Unlike trends in RCC incidence, there are no signs that the increase in partial nephrectomies is slowing down. Because the management of small kidney masses is complex, and given the availability and technological advances in diagnostic procedures, the development of tools able to distinguish indolent from more aggressive tumors should remain a priority.
When interpreting the findings of this study, several limitations should be recognized. Although the California Cancer Registry has consistently attained the North American Association of Central Cancer Registries’ gold standard status for data quality, completeness and timeliness, some variables in our study had missing values. During the study’s 25 years, an average of 36.9 percent of RCC cases had missing values for grade, and 10.2 percent had missing tumor size. Although the recording of tumor size improved substantially over time, the incidence of tumors of unknown grade has recently risen, hindering the interpretation of trends by tumor grade. In addition, given the length of time for cancer registries to collect complete incidence data, 2014 diagnoses were excluded due to only an estimated 97 percent completeness level. Another limitation is that many small kidney tumors are not biopsied, and would not have been confirmed as malignant. Notwithstanding these limitations, the quality of CCR data coupled with the size and extreme diversity of California population made it possible to perform granular analysis of trends by several demographic and clinical factors, as well as detect differences that would not have been detected in a smaller and less diversepopulation.
CONCLUSIONS
The marked increase in the incidence of RCC, observed in all population groups until 2007–2009, appears to have abated in recent years. Consistent with early detection, the previously reported increase in incidence was limited mostly to early-stage disease. In parallel with the increase in early-stage RCC, the use of partial nephrectomies increased markedly during the study period and has not declined. Although it is possible that other factors contributed to the earlier increased incidence of RCC, trends were consistent with incidental discovery of renal tumors stemming from the large increase in diagnostic imaging. Following the reported slowdown in the utilization on advanced diagnostic imaging, RCC incidence rates appear to have stabilized in California.
CONFLICTS OF INTEREST
There was no specific funding for this study, and the authors have no conflicts of interest to disclose.
ACKNOWLEDGMENTS
The collection of cancer incidence data used in this study was supported by California Department of Public Health as part of the statewide cancer reporting program mandated by the California Health and Safety Code Section 103885; the National Cancer Institute’s Surveillance, Epidemiology and End Results Program under contracts awarded to the Cancer Prevention Institute of California, the University of Southern California, and the Public Health Institute; and the Centers for Disease Control and Prevention’s National Program of Cancer Registries, under agreement awarded to the California Department of Public Health. The ideas and opinions expressed herein are those of the author(s) and endorsement by the State of California, Department of Public Health, the National Cancer Institute, the Centers for Disease Control and Prevention, or their Contractors and Subcontractors is not intended nor should beinferred.
REFERENCES
[1] | California Cancer Registry: Annual Statistical Tables by Site. http://www.ccrcal.org/Reports_and_Factsheets/Annual_Statistical_Tables_by_Site.shtml. Accessed May 20, 2016. |
[2] | Adams KF , et al. Body size and renal cell cancer incidence in alarge US cohort study. Am J Epidemiol (2008) ;168: (3):268–77. |
[3] | Chow WH , Devesa SS . Contemporary epidemiology of renal cell cancer. Cancer J (2008) ;14: (5):288–301. |
[4] | Chow WH , et al. Obesity and risk of renal cell cancer. CancerEpidemiol Biomarkers Prev (1996) ;5: (1):17–21. |
[5] | Decastro GJ , McKiernan JM . Epidemiology, clinical staging, and presentation of renal cell carcinoma. Urol Clin North Am (2008) ;35: (4):581–92; vi. |
[6] | Lipworth L , Tarone RE , McLaughlin JK . The epidemiology of renal cell carcinoma. J Urol (2006) ;176: (6 Pt 1):2353–8. |
[7] | Ljungberg B , et al. The epidemiology of renal cell carcinoma. Eur Urol (2011) ;60: (4):615–21. |
[8] | Howlader N , Noone AM , Krapcho M , Miller D , Bishop K , Altekruse SF , Kosary CL , Yu M , Ruhl J , Tatalovich Z , Mariotto A , Lewis DR , Chen HS , Feuer EJ , Cronin KA , (eds). SEER Cancer Statistics Review, 1975-2013, National Cancer Institute, Bethesda, MD, http://seer.cancer.gov/csr/1975_2013/, based on November 2015 SEER data submission, posted to the SEERweb site, April 2016. |
[9] | Chow WH , et al. Rising incidence of renal cell cancer in the United States. JAMA (1999) ;281: (17):1628–31. |
[10] | Hock LM , Lynch J , Balaji KC . Increasing incidence of all stages of kidney cancer in the last 2 decades in the United States: An analysis of surveillance, epidemiology and end results program data. J Urol (2002) ;167: (1):57–60. |
[11] | King SC , et al. Continued increase in incidence of renal cell carcinoma, especially in young patients and high grade disease: United States 2001 to 2010. J Urol (2014) ;191: (6):1665–70. |
[12] | Knox M , Colli JL . Characterizing changes in kidney and renal pelvis cancer incidence from 1998 to 2006 in the United States. Int Urol Nephrol (2011) ;43: (2):359–63. |
[13] | Nepple KG , et al. Population based analysis of the increasing incidence of kidney cancer in the United States: Evaluation of age specific trends from 1975 to 2006. J Urol (2012) ;187: (1):32–8. |
[14] | Stafford HS , et al. Racial/ethnic and gender disparities in renal cell carcinoma incidence and survival. J Urol (2008) ;179: (5):1704–8. |
[15] | Sun M , et al. Age-adjusted incidence, mortality, and survival rates of stage-specific renal cell carcinoma in North America: A trend analysis. Eur Urol (2011) ;59: (1):135–41. |
[16] | Jayson M , Sanders H . Increased incidence of serendipitously discovered renal cell carcinoma. Urology (1998) ;51: (2):203–5. |
[17] | Luciani LG , Cestari R , Tallarigo C . Incidental renal cell carcinoma-age and stage characterization and clinical implications: Study of 1092 patients (1982-1997). Urology (2000) ;56: (1):58–62. |
[18] | Freid VM , Bernstein AB . Health care utilization among adults aged 55-64 years: How has it changed over the past 10 years? NCHS Data Brief (2010) (32):1–8. |
[19] | Maitino AJ , et al. Nationwide trends in rates of utilization of noninvasive diagnostic imaging among the Medicare population between 1993 and 1999. Radiology (2003) ;227: (1):113–7. |
[20] | Smith-Bindman R , et al. Use of diagnostic imaging studies and associated radiation exposure for patients enrolled in large integrated health care systems, 1996-2010. JAMA (2012) ;307: (22):2400–9. |
[21] | Mullins PM , Goyal M , Pines JM . National growth in intensive care unit admissions from emergency departments in the United States from 2002 to 2009. Acad Emerg Med (2013) ;20: (5):479–86. |
[22] | Mitchell JM . Utilization trends for advanced imaging procedures: Evidence from individuals with private insurance coverage in California. Med Care (2008) ;46: (5):460–6. |
[23] | Lang K , et al. National trends in advanced outpatient diagnostic imaging utilization: An analysis of the medical expenditure panel survey, 2000-2009. BMC Med Imaging (2013) ;13: :40. |
[24] | Levin DC , et al. Continued growth in emergency department imaging is bucking the overall trends. J Am Coll Radiol (2014) ;11: (11):1044–7. |
[25] | Van Poppel H , et al. A prospective, randomised EORTC intergroup phase 3 study comparing the oncologic outcome of elective nephron-sparing surgery and radical nephrectomy for low-stage renal cell carcinoma. Eur Urol (2011) ;59: (4):543–52. |
[26] | Fritz APC , Jack A , Shanmugaratnam K , Sobin L , Parkin DM , Whelan S , eds. International Classification of Diseases for Oncology, Third Edition. World Health Organization, Geneva, (2000) . |
[27] | Young JL Jr , Roffers SD , Ries LAG , Fritz AG , Hurlbut AA , (eds). SEER Summary Staging Manual -2000: Codes and Coding Instructions, National Cancer Institute, NIH Pub. No. 01-4969, Bethesda, MD, (2001) . |
[28] | Edge SB, Byrd DR, Compton CC, Fritz AG, Greene FL, Trotti A, eds. AJCC Cancer Staging Manual. 7th edition. Springer-Verlag, New York, NY, (2010) . |
[29] | NAACCR Hispanic and Asian/Pacific Islander IdentificationAlgorithm (NHAPIIA). https://www.naaccr.org/Research/DataAnalysisTools.aspx |
[30] | Yost K , et al. Socioeconomic status and breast cancer incidence in California for different race/ethnic groups. Cancer Causes Control (2001) ;12: (8):703–11. |
[31] | Yang J, Schupp CW, Harrati A, Clarke C, Keegan THM, Gomez SL. Developing an area-based socioeconomic measure from American Community Survey data, Cancer Prevention Institute of California, Fremont, CA, (2014) . |
[32] | American College of Surgeons., Commission on Cancer. FacilityOncology Registry Data Standards (FORDS), (2015) . https://www.facs.org/~/media/files/quality%20programs/cancer/coc/fords/fords%15.ashx |
[33] | Kim HJ , Fay MP , Feuer EJ , Midthune DN . Permutation tests for joinpoint regression with applications to cancer rates. Stat Med (2001) ;19: :335–51 (correction: 2001;20:655). |
[34] | California Department of Public Health, C.T.C.P.C.T.F.a.F.p.-p.v.S., CA: California Department ofPublic Health; (2016) . |
[35] | Pines JM , et al. National trends in emergency department use, care patterns, and quality of care of older adults in the United States. J Am Geriatr Soc (2013) ;61: (1):12–7. |
[36] | Lee DW , Duszak R , Hughes DR . Comparative analysis of medicare spending for medical imaging: Sustained dramatic slowdown compared with other services. American Journal of Roentgenology (2013) ;201: (6):1277–82. |
[37] | Levin DC , et al. The sharp reductions in medicare payments for noninvasive diagnostic imaging in recent years: Will they satisfy the federal policymakers? Journal of the American College of Radiology (2016) ;9: (9):643–7. |
[38] | Harvey L . Neiman Health Policy Institute. Medical Imaging: Is the Growth Boom Over? Neiman Report Brief #01, October 2012. |
[39] | Smaldone MC , Corcoran AT , Uzzo RG . Active surveillance of small renal masses. Nat Rev Urol (2013) ;10: (5):266–74. |
[40] | Welch HG , Black WC . Overdiagnosis in cancer. J Natl Cancer Inst (2010) ;102: (9):605–13. |
[41] | Gandaglia G , et al. Contemporary incidence and mortality rates of kidney cancer in the United States. Can Urol Assoc J (2014) ;8: (7-8):247–52. |
[42] | Hwang EC , Yu HS , Kwon DD . Small renal masses: Surgery or surveillance. Korean J Urol (2013) ;54: (5):283–8. |
[43] | Fenton JJ , Weiss NS . Screening computed tomography: Will it result in overdiagnosis of renal carcinoma? Cancer (2004) ;100: (5):986–90. |
[44] | Porter MP , Lin DW . Trends in renal cancer surgery and patient provider characteristics associated with partial nephrectomy in the United States. Urol Oncol (2007) ;25: (4):298–302. |
[45] | Kondo T . Editorial comment to Partial and radical nephrectomy provide comparable long-term cancer control for T1b renal cell carcinoma. Int J Urol (2014) ;21: (2):128–9. |
[46] | Colli J , et al. Underutilization of partial nephrectomy for stage T1 renal cell carcinoma in the United States, trends from 2000 to2008. A long way to go. Clin Genitourin Cancer (2012) ;10: (4):219–24. |
[47] | Miller DC , et al. Contemporary clinical epidemiology of renal cell carcinoma: Insight from a population based case-control study. J Urol (2010) ;184: (6):2254–8. |
[48] | Hollenbeck BK , et al. National utilization trends of partial nephrectomy for renal cell carcinoma: A case of underutilization? Urology (2006) ;67: (2):254–9. |
[49] | Touijer K , et al. The expanding role of partial nephrectomy: A critical analysis of indications, results, and complications. Eur Urol (2010) ;57: (2):214–22. |

