
Bi-directional Association of Cerebrospinal Fluid Immune Markers with Stage of Alzheimer’s Disease Pathogenesis
Abstract
Immune mechanisms may be important in the pathogenesis of Alzheimer’s disease (AD). Yet, studies comparing cerebrospinal fluid (CSF) and plasma immune marker levels of healthy and demented individuals have yielded conflicting results. We analyzed CSF from 101 members of the parental history-positive PREVENT-AD cohort of healthy aging adults, and 237 participants without dementia from the initial cohort of the Alzheimer’s Disease Neuroimaging Initiative (ADNI-1). Following recent practice, we used the biomarkers total-tau and amyloid-β1-42 to allocate participants from each study into four stages of AD pathogenesis: Stage 0 (no abnormality), Stage 1 (reduced amyloid-β1-42), Stage 2 (reduced amyloid-β1-42 and increased total-tau), or “Suspected Non-Alzheimer Pathology” (elevated total-tau only). Investigating the PREVENT-AD participants’ CSF assay results for 19 immune/inflammatory markers, we found six that showed a distinct bi-directional relationship with pathogenetic stage. Relative to Stage 0, these were diminished at Stage 1 but strongly increased at Stage 2. Among the ADNI participants (90 healthy controls and 147 with mild cognitive impairment), we found that 23 of 83 available CSF markers also showed this distinct pattern. These results support recent observations that immune activation may become apparent only after the onset of both amyloid and tau pathologies. Unexpectedly, they also suggest that immune marker activity may diminish along with earliest appearance of amyloid-β plaque pathology. These findings may explain discordant results from past studies, and suggest the importance of characterizing the extent of AD pathology when comparing clinical groups.
INTRODUCTION
Alzheimer’s disease (AD) is a neurodegenerative disorder characterized by extracellular amyloid-β (Aβ) plaques, intracellular tau neurofibrillary tangles, and widespread synapse loss. A decades-long period of pathogenetic change precedes the appearance of dementia [1–3]. Immune mechanisms are thought to be important in this process [4]. In the early 1990s, McGeer et al. [5] observed that co-existence of AD and rheumatoid arthritis (RA) was rare in autopsy data. These investigators had earlier observed that inflammatory processes were vigorous in the vicinity of AD lesions [6]. Because RA is often treated with anti-inflammatory drugs, they suggested that the latter might explain the low prevalence of AD changes in RA patients. Ensuing epidemiological studies identified an inverse relationship between the use of non-steroidal anti-inflammatory drugs and incidence of AD (for review, see [4]). More recently, genetic studies have identified immune/inflammatory pathways as modifiers of AD dementia risk [7–10]. Inflammatory changes are therefore thought to be a response to appearance of AD pathology, increasing linearly with disease progression. It is widely assumed that such inflammatory activity is harmful.
In fact, this last notion has not been verified in vivo by measures in plasma or cerebrospinal fluid (CSF) [11]. Instead, investigations in fully penetrant autosomal dominant familial AD suggest that significant increases in immune signaling may occur only after the appearance of both Aβ and tau pathologies [12]. Similarly, other studies of the association of single CSF immune markers and AD pathology have suggested that the former decline concurrently with reduction in Aβ1-42 concentration that typifies early AD pathogenesis [13–15]. Here we describe multi-analyte investigations of the association between AD pathogenesis, as revealed by CSF biomarkers, and several immune/inflammatory proteins. We report initial observations in the high-risk PREVENT-AD cohort of healthy older persons, followed by analyses of CSF from the Alzheimer’s Disease Neuroimaging Initiative (ADNI-1). Our objective was to determine whether variations in AD pathological “stage” [16, 17] related to CSF immune and other protein levels, and whether such varied association could explain conflicting results from past studies.
METHODS
Participants
PREVENT-AD participants (Table 1) were 101 cognitively intact volunteers with a parental or multiple-sibling history of “sporadic” AD [18]. They scored an education-adjusted ≥23/30 on the Montreal Cognitive Assessment [19], and had little if any difficulty with subsequent cognitive testing. Most were 60 years of age or older, but persons aged 55–59 years were eligible if their age was within 15 years of their youngest-affected relative’s onset. Each participant and study partner provided written informed consent. All procedures were approved by the McGill University Faculty of Medicine Institutional Review Board. All research complied with ethical principles of the Declaration of Helsinki.
Table 1
PREVENT-AD and ADNI demographics
| PREVENT-AD | ADNI-1 | |||||||||
| All participants | Stage 0 | Stage 1 | Stage 2 | SNAP | All participants | Stage 0 | Stage 1 | Stage 2 | SNAP | |
| Sample | 101‡ | 51 | 12 | 9 | 10 | 237 | 78 | 71 | 79 | 9 |
| Age Mean (sd) | 62.90 (5.56) | 62.80 (5.31) | 60.91 (5.52) | 63.99 (4.39) | 64.52 (8.66) | 75.26 (6.68) | 75.24 (6.71) | 75.48 (6.09) | 74.77 (7.40) | 77.89 (4.04) |
| % Male | 30.69 | 35.29 | 25 | 55.56 | 30 | 61.60 | 64.10 | 61.97 | 62.03 | 33.33 |
| % APOE4-positive | 36.63 | 31.37 | 50 | 88.89 | 20 | 42.19 | 10.26 | 52.11 | 68.35 | 11.11 |
| Clinical Diagnostic Category (HC: MCI) | 101: 0 | 51: 0 | 12: 0 | 9: 0 | 10: 0 | 90: 147 | 49: 29 | 23: 48 | 11: 68 | 7: 2 |
| Education (y) Mean (sd) | 14.88 (2.93) | 15.00 (2.89) | 14.92 (2.35) | 13.67 (3.32) | 15.1 (1.59) | 15.83 (2.94) | 15.82 (2.76) | 15.76 (3.15) | 15.73 (2.94) | 17.33 (2.79) |
| CSF Aβ1-42 (pg/mL) Mean (sd)** | 1062.91 (280.65) | 1161.58 (158.54) | 705.02 (115.67) | 611.35 (85.68) | 1422.15 (113.63) | 178.50 (56.06) | 244.41 (24.71) | 146.44 (22.31) | 133.95 (21.90) | 251.20 (28.32) |
| CSF t-tau (pg/mL) Mean (sd)** | 273.09 (129.97) | 221.94 (56.14) | 177.59 (73.16) | 522.45 (162.64) | 435.48 (90.79) | 92.17 (49.85) | 58.08 (15.30) | 67.47 (17.38) | 146.15 (47.97) | 108.58 (12.95) |
| CSF P-tau (pg/mL) Mean (sd)** | 46.83 (18.00) | 40.25 (10.37) | 32.70 (10.71) | 75.47 (19.89) | 72.29 (11.45) | 31.91 (15.94) | 20.14 (7.20) | 27.20 (13.00) | 47.83 (11.95) | 31.33 (8.92) |
pg/mL, picograms per milliliter; sd, standard deviation; % APOE, proportion of APOE ɛ4 carriers; SNAP, Suspected Non-Alzheimer Pathology; HC, healthy controls; MCI, mild cognitive impairment; **ADNI and PREVENT-AD used different assays to measure AD biomarkers. ‡ To enhance contrast, 19 individuals within±5% of inter-stage thresholds were not assigned to a stage, except as noted in text. See text also for definition of the several stages.
ADNI-1 data were downloaded in February 2016 from http://adni.loni.usc.edu. ADNI was launched in 2003 as a public-private partnership led by Principal Investigator Michael W. Weiner. Its primary goal has been to test whether serial magnetic resonance imaging, positron emission tomography (PET), and various clinical, biological and neuropsychological markers can be combined to measure progression of MCI and early AD. Given our interest in analyses of ADNI participants before onset of dementia, we limited analyses to 237 ADNI-1 participants with available CSF data from the healthy control (n = 90) and MCI groups (n = 147), the latter to enrich for persons with likely Aβ or tau pathology (Table 1).
Cerebrospinal fluid measurements
Lumbar punctures (LPs) in PREVENT-AD volunteers were performed following an overnight fast using the Sprotte 24-gauge atraumatic needle. Samples of 20–30 mL were aliquoted (500 μL) into propylene cryotubes and stored at –80°C. We used procedures from the BIOMARK-APD consortium of the EU Joint Program in Neurodegenerative Diseases, to measure CSF concentrations of the AD biomarkers Aβ1-42, total-tau (t-tau) and P181-tau (P-tau) using the Innotest enzyme-linked immunosorbent assay kit (Fujirebio, Ghent, Belgium). CSF apolipoprotein E (apoE) levels were assayed using the Milliplex APOMAG-62k human apolipoprotein cardiovascular disease multiplex kit (EMD-Millipore, Billerica, MA, USA).
To characterize immune/inflammatory status, we attempted to assay CSF concentrations of 45 cytokines and chemokines using a combination of the Milliplex HCYTMAG60PMX29BK xMap kit (EMD-Millipore; Supplementary Methods) and the Mesoscale V-plex neuro-inflammation panel-1 (Mesoscale Discovery, Rockville, MD). Detailed procedures for the latter have been described elsewhere [20]. We excluded measures that fell outside the useful assay range. We also excluded markers with excessive assay variation, as measured by a mean coefficient of variation exceeding 15%. We then performed an outlier analysis to identify and remove from consideration assay values above the third or below the first quartile±1.5 times the interquartile distance [21]. After applying these QC restrictions, there remained 10 markers (out of 21 initially) that were assayed using both Mesoscale and Luminex technologies. We compared the two techniques’ agreement and range of values for each analyte. When necessary, we chose the marker assay with more quality-control acceptable readings or without ceiling or floor effects. We excluded analytes having ≤50 quality-control-acceptable readings from at least one assay technique. Nineteen immune marker assays met these standards.
The ADNI investigators had measured CSF Aβ1-42 and t-tau concentrations using Research Use Only INNOBIA AlzBio3 immunoassay reagents (Fujirebio) on an xMap Luminex platform (http://adni.loni.usc.edu/methods/biomarker-analysis/). CSF levels of 83 other proteins had been assayed via a multiplex x-Map kit from Rules Based Medicine (MyriadRBM, Austin, TX). Rigorous quality control standards excluded markers with >10% missing data. Results were then normalized using boxcox transformation, etc. (for details, see http://adni.loni.usc.edu/wp-content/uploads/2012/01/2011Dec28-Biomarkers-Consortium-Data-Primer-FINAL1.pdf.)
Pathological staging of participants
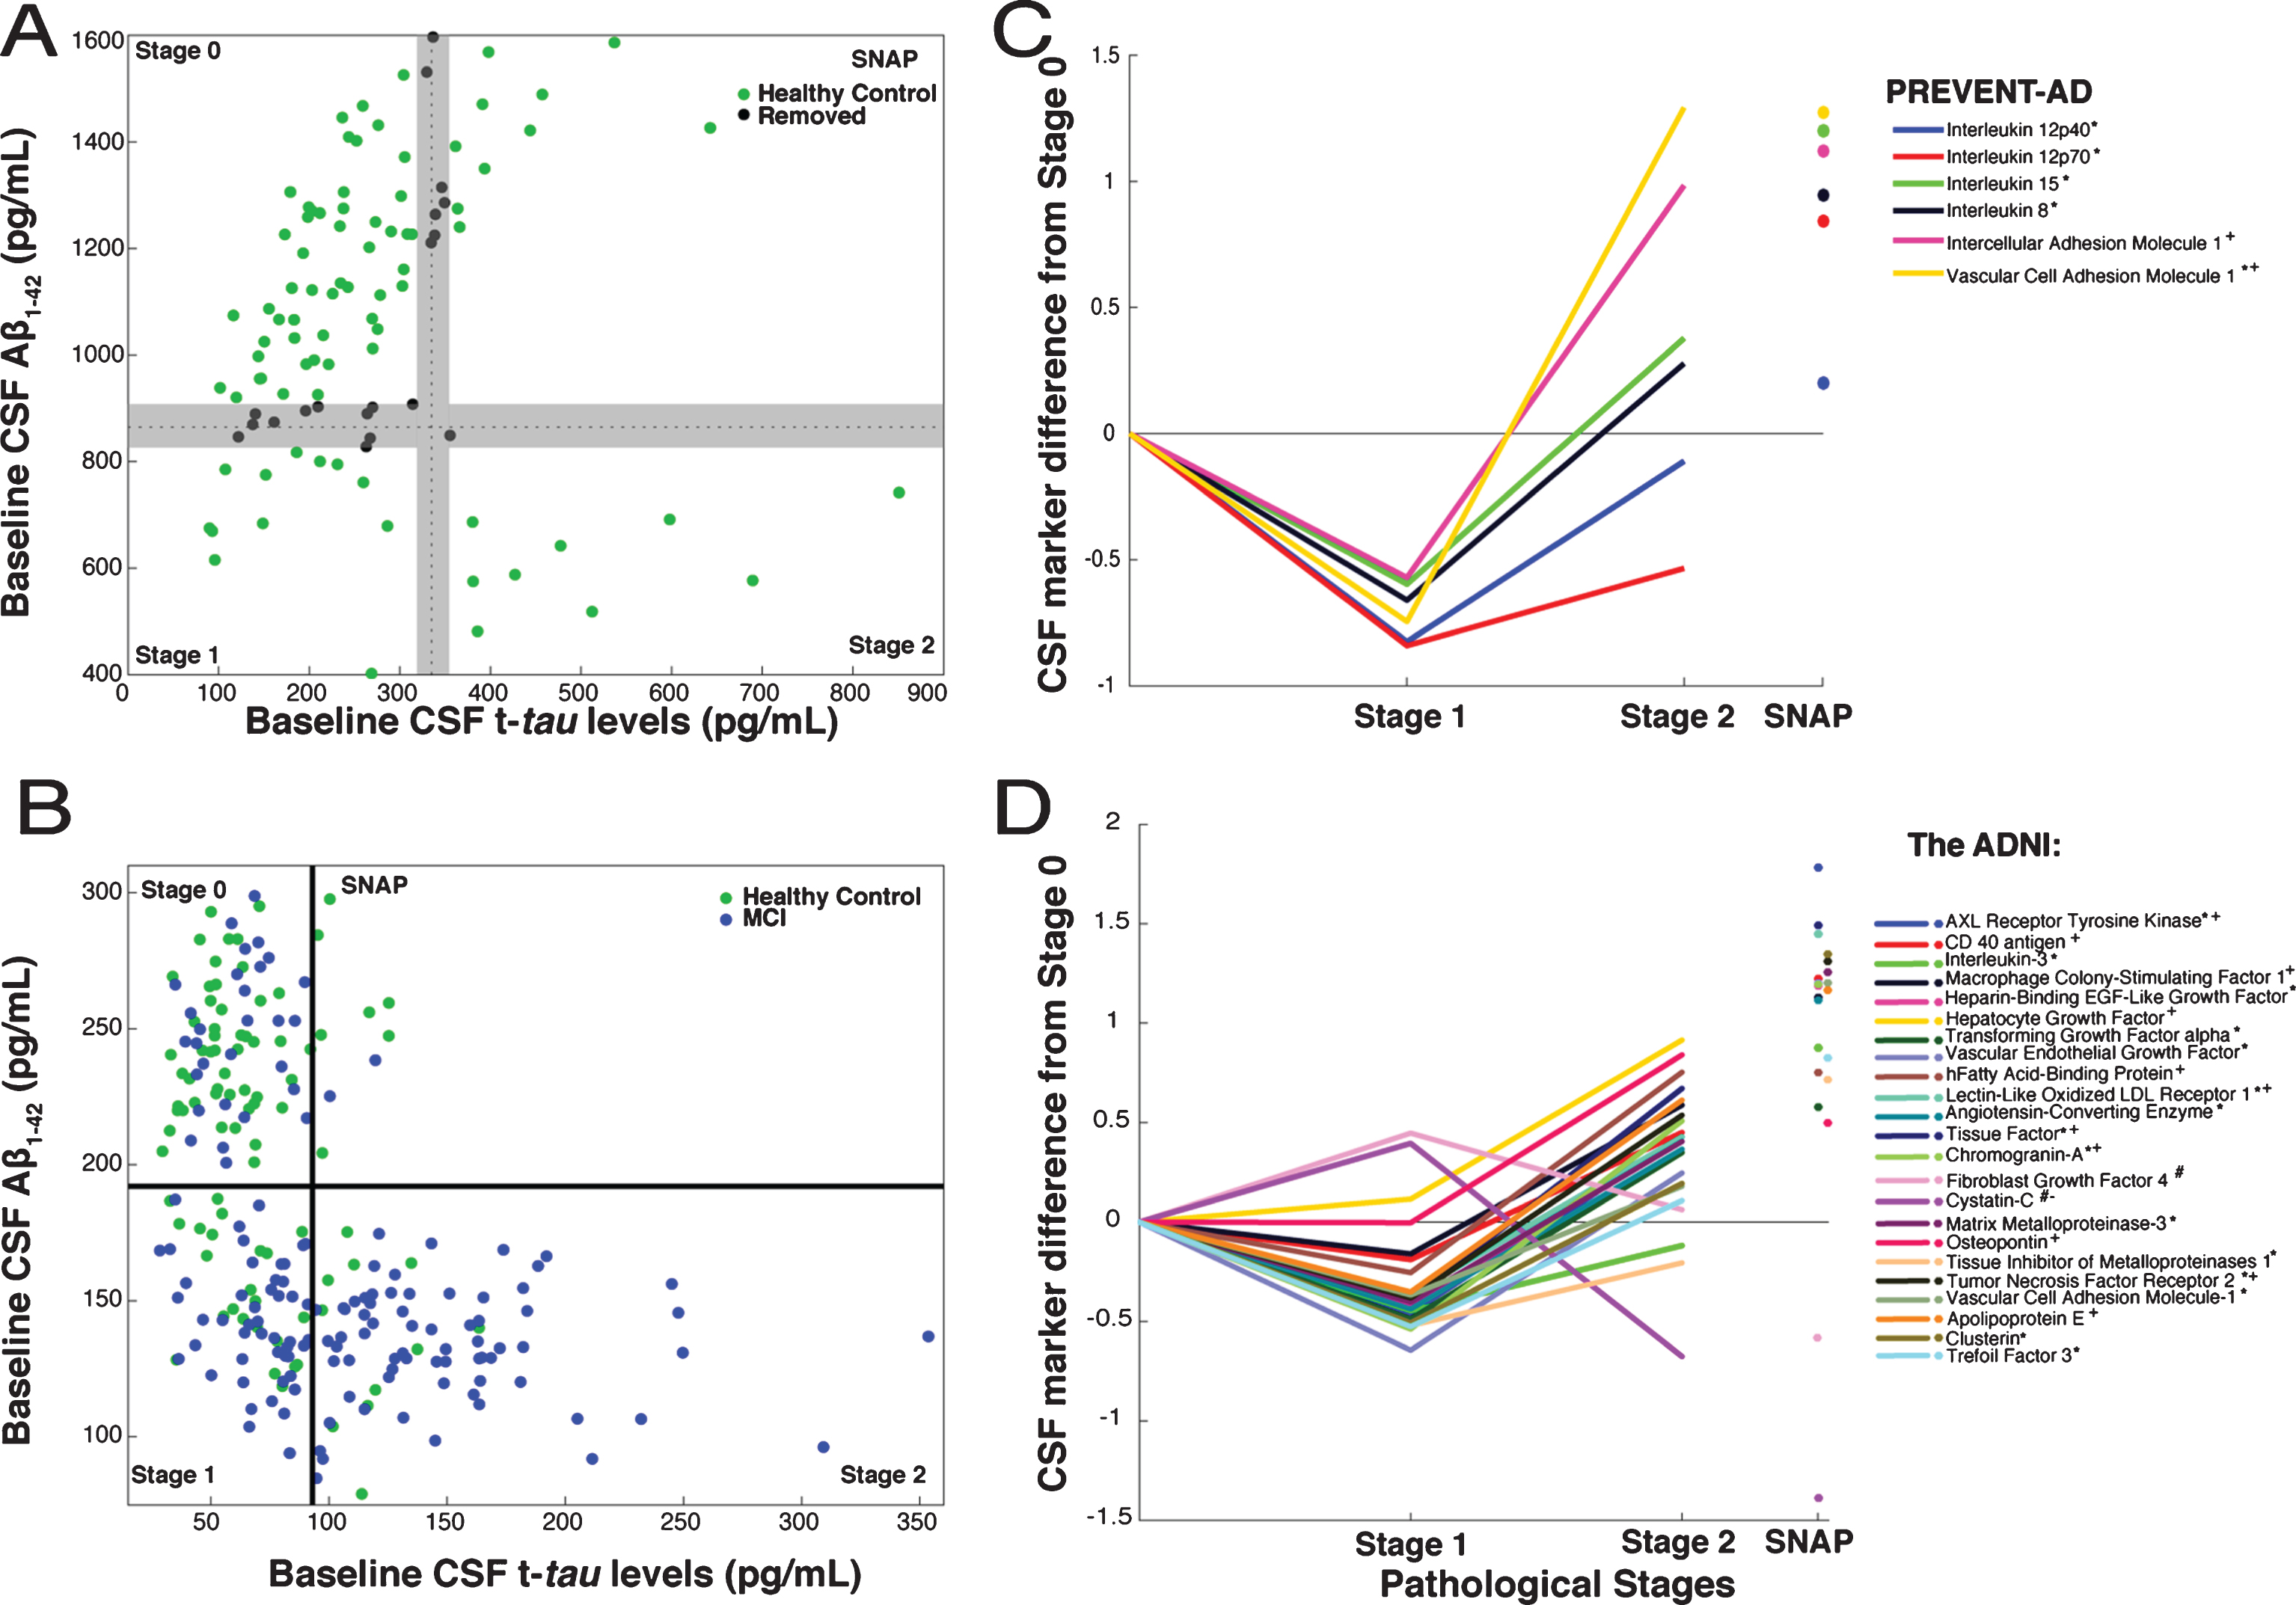
Following recent convention [16, 17], we used CSF biomarker data to characterize extent of AD pathology in both PREVENT-AD and ADNI. Disease progress was classified as Stage 0 (normal CSF Aβ1-42 and t-tau), Stage 1 (low Aβ1-42, low t-tau), Stage 2 (low Aβ1-42 and elevated t-tau), and Suspected Non-Alzheimer Pathology (SNAP, high t-tau only). Very few PREVENT-AD participants met the typical “below-normal amyloid” threshold of 550 pg/mL. However, that threshold is intended to discriminate healthy controls from subjects with AD dementia, and may be too stringent for identification of persons with early Aβ pathology [22]. Given recent evidence that increasing amyloid burden (reflected by decreasing CSF amyloid concentration) portends poorer clinical outcomes even before typical thresholds are crossed [23–25], we chose a more sensitive cut-off value for Aβ1-42 abnormality at the 25th percentile value or <870 pg/mL. Similarly, we specified a t-tau abnormality threshold at the 75th percentile, or >335 pg/mL (Fig. 1A). Since ADNI analyses, which used different assay methods, had included individuals with MCI we adopted the recommended Aβ and tau thresholds of <192 pg/mL and >93 pg/ml (Fig. 1B) [26]. Because our PREVENT-AD thresholds were somewhat arbitrary, and because we wished if possible to increase contrasts between stages, we decided a priori to exclude data from 19 PREVENT-AD individuals whose marker concentrations were within±5% of either the Aβ or tau threshold.
Fig.1
CSF markers and pathological staging of Alzheimer’s disease. A) 101 healthy PREVENT-AD participants were classified as Stage 0, 1, 2, or SNAP based on Aβ1-42 (869.75 pg/mL) and t-tau (334.6 pg/mL) thresholds. Among them, to enhance contrasts, 19 (black) having CSF Aβ and t-tau levels within±5% of inter-stage thresholds were removed a priori from consideration. B) ADNI healthy-control (green) and MCI (blue) participants were similarly classified using the project’s recommended thresholds for Aβ1-42 (192 pg/mL) and t-tau (93 pg/mL). C, D) Linear models, adjusted for participants’ age, gender, APOEɛ4 carrier status and (for ADNI only) clinical diagnostic category, were used to assess CSF protein marker level differences by stage. CSF marker data were standardized using z-scores. The β coefficients for stage differences from these models are represented. In PREVENT-AD (C), six CSF markers were associated bi-directionally with pathological stage. Five were lower (*) in Stage 1 versus Stage 0, and two were greater (+) in Stage 2 versus Stage 0 (p≤0.05 uncorrected). In ADNI (D), 23 CSF markers were either increased (#) or decreased (*) at Stage 1 and at Stage 2 (+ or –) vs. Stage 0. All 23 were significantly different at Stage 2 versus Stage 1 (pFDR ≤ 0.05).
APOE genotyping
In PREVENT-AD, APOE genotype was determined using the PyroMark Q96 pyrosequencer (Qiagen, Toronto, ON, Canada). DNA was amplified using RT-PCR with primers rs429358 amplification forward 5’-ACGGCTGTCCAAGGAGCT G-3’, rs429358 amplification reverse biotinylated 5′-CACCTCGCCGCGGTACTG-3′, rs429358 sequencing 5′-CGGACATGGAGGACG-3′, rs7412 amplification forward 5′-CTCCGCGATGCCGATGAC-3′, rs7412 amplification reverse biotinylated 5′-CCCCGGCCTGGTACACTG-3′ and rs7412 sequencing 5′-CGATGACCTGCAGAAG-3′. In ADNI, APOE genotypes had been determined using DNA extracted by Cogenics (Beckman-Coulter, Pasadena, CA) [27].
Statistical analyses
In PREVENT-AD, we used multiple linear regression to examine the association of standardized (z-score) concentrations of the 19 immune markers or apoE with pathological stage. To examine agreement of our results with prior studies, we assessed association of these same marker scores with the individual CSF AD biomarkers Aβ1-42, t-tau, P181-tau, and the t-tau/Aβ1-42 ratio. To meet model assumptions, we log-transformed P-tau and t-tau, and used boxcox transformation to normalize the t-tau/Aβ ratio. Models were adjusted for participant age, gender, and APOE ɛ4 carrier status. p-values were corrected, as elsewhere, for multiple comparisons using the false discovery rate (FDR) method [28] specifying two-sided α= 0.05. Analyses relied on Matlab (Mathworks Inc.; Natick, Massachusetts), SPSS24 (IBM Corp.; Armonk, NY) or R v3.2.2.
We then tested the robustness of our PREVENT-AD findings in the ADNI-1 cohort. To deal with the multiple available ADNI protein markers, we used Bayes factor analysis, employing Matlab’s CGBayesNets [29], to identify and remove molecular species unlikely to be associated with pathological stage. The Bayes’ Factor is the ratio of posterior likelihoods of the data being associated with vs. independent of pathological stage [30]. We kept only individual markers with a (logarithmic) Bayes’ Factor >0, thus providing any evidence in favor of an association between marker levels and pathological stage. Multiple linear regression models then identified markers that differed by stage after adjustment for participant age, gender, APOE ɛ4 carrier status and clinical diagnostic group. As in PREVENT-AD, we also used regression models to assess association of these markers with Aβ1-42, t-tau, P181-tau, and the t-tau/Aβ1-42 ratio.
RESULTS
Demographic characteristics
Demographic characteristics of both the PREVENT-AD and ADNI-1 participants are summarized in Table 1. Whereas PREVENT-AD included 70% women, ADNI-1 had a majority of men. ADNI participants were also more than a decade older on average. The table indicates the two groups’ distributions by pathological stage. As expected, ADNI included larger proportions of persons at Stages 1 or 2.
PREVENT-AD immune marker concentrations and pathological stage
After categorizing PREVENT-AD participants by pathological stage, FDR-adjusted models revealed only trend-level differences in the 20 analyzed markers when comparing Stage 0 versus Stage 1 or Stage 2. Inference here was limited, however, by the small number of individuals at Stages 1 and 2. Omitting FDR adjustment, we observed a consistent bi-directional pattern of association between six marker scores and pathological stage, with reduced concentrations at Stage 1 and/or increased levels at Stage 2 (Table 2, Fig. 1C). Because a post hoc power analysis indicated that we had less than the desired 90% power to observe a statistically significant effect for IL-12p40, however, results with this latter marker should be interpreted cautiously. As well, IL-15, IL-8, ICAM-1, and VCAM-1 showed significant elevation at Stage 2 vs. Stage 1 (Fig. 1C). Despite the small size of the SNAP sample, this group showed elevation after FDR adjustment in all of the above-mentioned markers as well as granulocyte colony-stimulating factor (GCSF), interferon gamma-induced protein 10 (IP-10), and IL-16 (Supplementary Table 1).
Table 2
PREVENT-AD and ADNI cerebrospinal fluid markers associated with Alzheimer’s disease pathological stages
| PREVENT-AD | ADNI | |
| IL-12p40 | AXL Receptor Tyrosine Kinase | Chromogranin A |
| IL-12p70 | CD40 antigen | Cystatin-C |
| IL-8 | IL-3 | Fibroblast Growth Factor 4 |
| IL-15 | Macrophage Colony Stimulating Factor-1 | Matrix Metalloproteinase-3 |
| Soluble Vascular Cell Adhesion Molecule-1 (sVCAM-1) | Heparin-Binding EGF-Like Growth Factor | Osteopontin |
| Soluble Intercellular Cell Adhesion Molecule-1 (sICAM-1) | Hepatocyte Growth Factor | Tissue Inhibitor of Metalloproteinases-1 |
| Transforming Growth Factor α | Tumor Necrosis Factor Receptor-2 | |
| Vascular Endothelial Growth Factor | Vascular Cell Adhesion Molecule-1 | |
| Heart Fatty Acid Binding Protein | Apolipoprotein-E | |
| Lectin like Oxidized LDL-Receptor-1 | Clusterin (Apolipoprotein J) | |
| Angiotensin Converting Enzyme | Trefoil Factor-3 | |
| Tissue Factor |
PREVENT-AD immune marker concentrations and AD biomarkers
In corroborative analyses, we found that apoE and seven of the 19 CSF immune markers in PREVENT-AD increased with t-tau/Aβ1-42 ratio (pFDR ≤ 0.05, Supplementary Table 2). Levels of these markers increased especially with t-tau and P-tau. Interestingly, four markers (apoE, IL-15, IL-8, and IL-12p70) also increased with Aβ concentration, suggesting reduced plaque burden [31, 32]. Although unexpected, this association between increasing levels of immune markers and Aβ has noted before [12–15]. It provides one possible explanation for the bi-directional pattern in Fig. 1C.
ADNI protein marker concentrations, pathological stage, and AD biomarkers
Given the limited size of the PREVENT-AD sample, we wished to verify whether this bi-phasic pattern generalized to other proteins assayed in CSF. Thus, we pursued similar analyses in ADNI-1, including participants with MCI. Bayes factor analysis reduced the 83 ADNI CSF protein markers to 38 with any likelihood of association to pathological stage (Fig. 2). Multiple linear regression modeling then showed that 23 of these differed significantly between Stage 0 and Stage 1 or Stage 2 (pFDR ≤ 0.05; Fig. 1D, Supplementary Table 3). Marker results by stage again revealed bi-directional patterns, with all but two markers showing reduction at Stage 1 and/or increase at Stage 2. Exceptions were Cystatin-C and fibroblast growth factor-4 (FGF-4), which showed the opposite pattern. Importantly, all remaining markers were increased at Stage 2 vs. Stage 1. As in PREVENT-AD, all but three of these (IL-3, tissue inhibitor of metalloproteinase-1, and FGF-4) correlated overall with t-tau/Aβ1-42 ratio (Supplementary Table 4).
Fig.2
Bayes factor analysis identifies 38 ADNI CSF markers potentially associated with pathological stage. Shown is a matrix representation of linear regression models predicting association of 38 CSF marker levels with pathological stage with adjustment for age, gender, clinical diagnostic category, and APOE status. T-values for each association are reported. For categorical variables, the results are shown as comparisons against a reference. For gender, the reference category is male; for APOE it is non-carriage of ɛ4; for diagnosis (Dx), healthy control; and for pathological stage, Stage 0 (no abnormality).
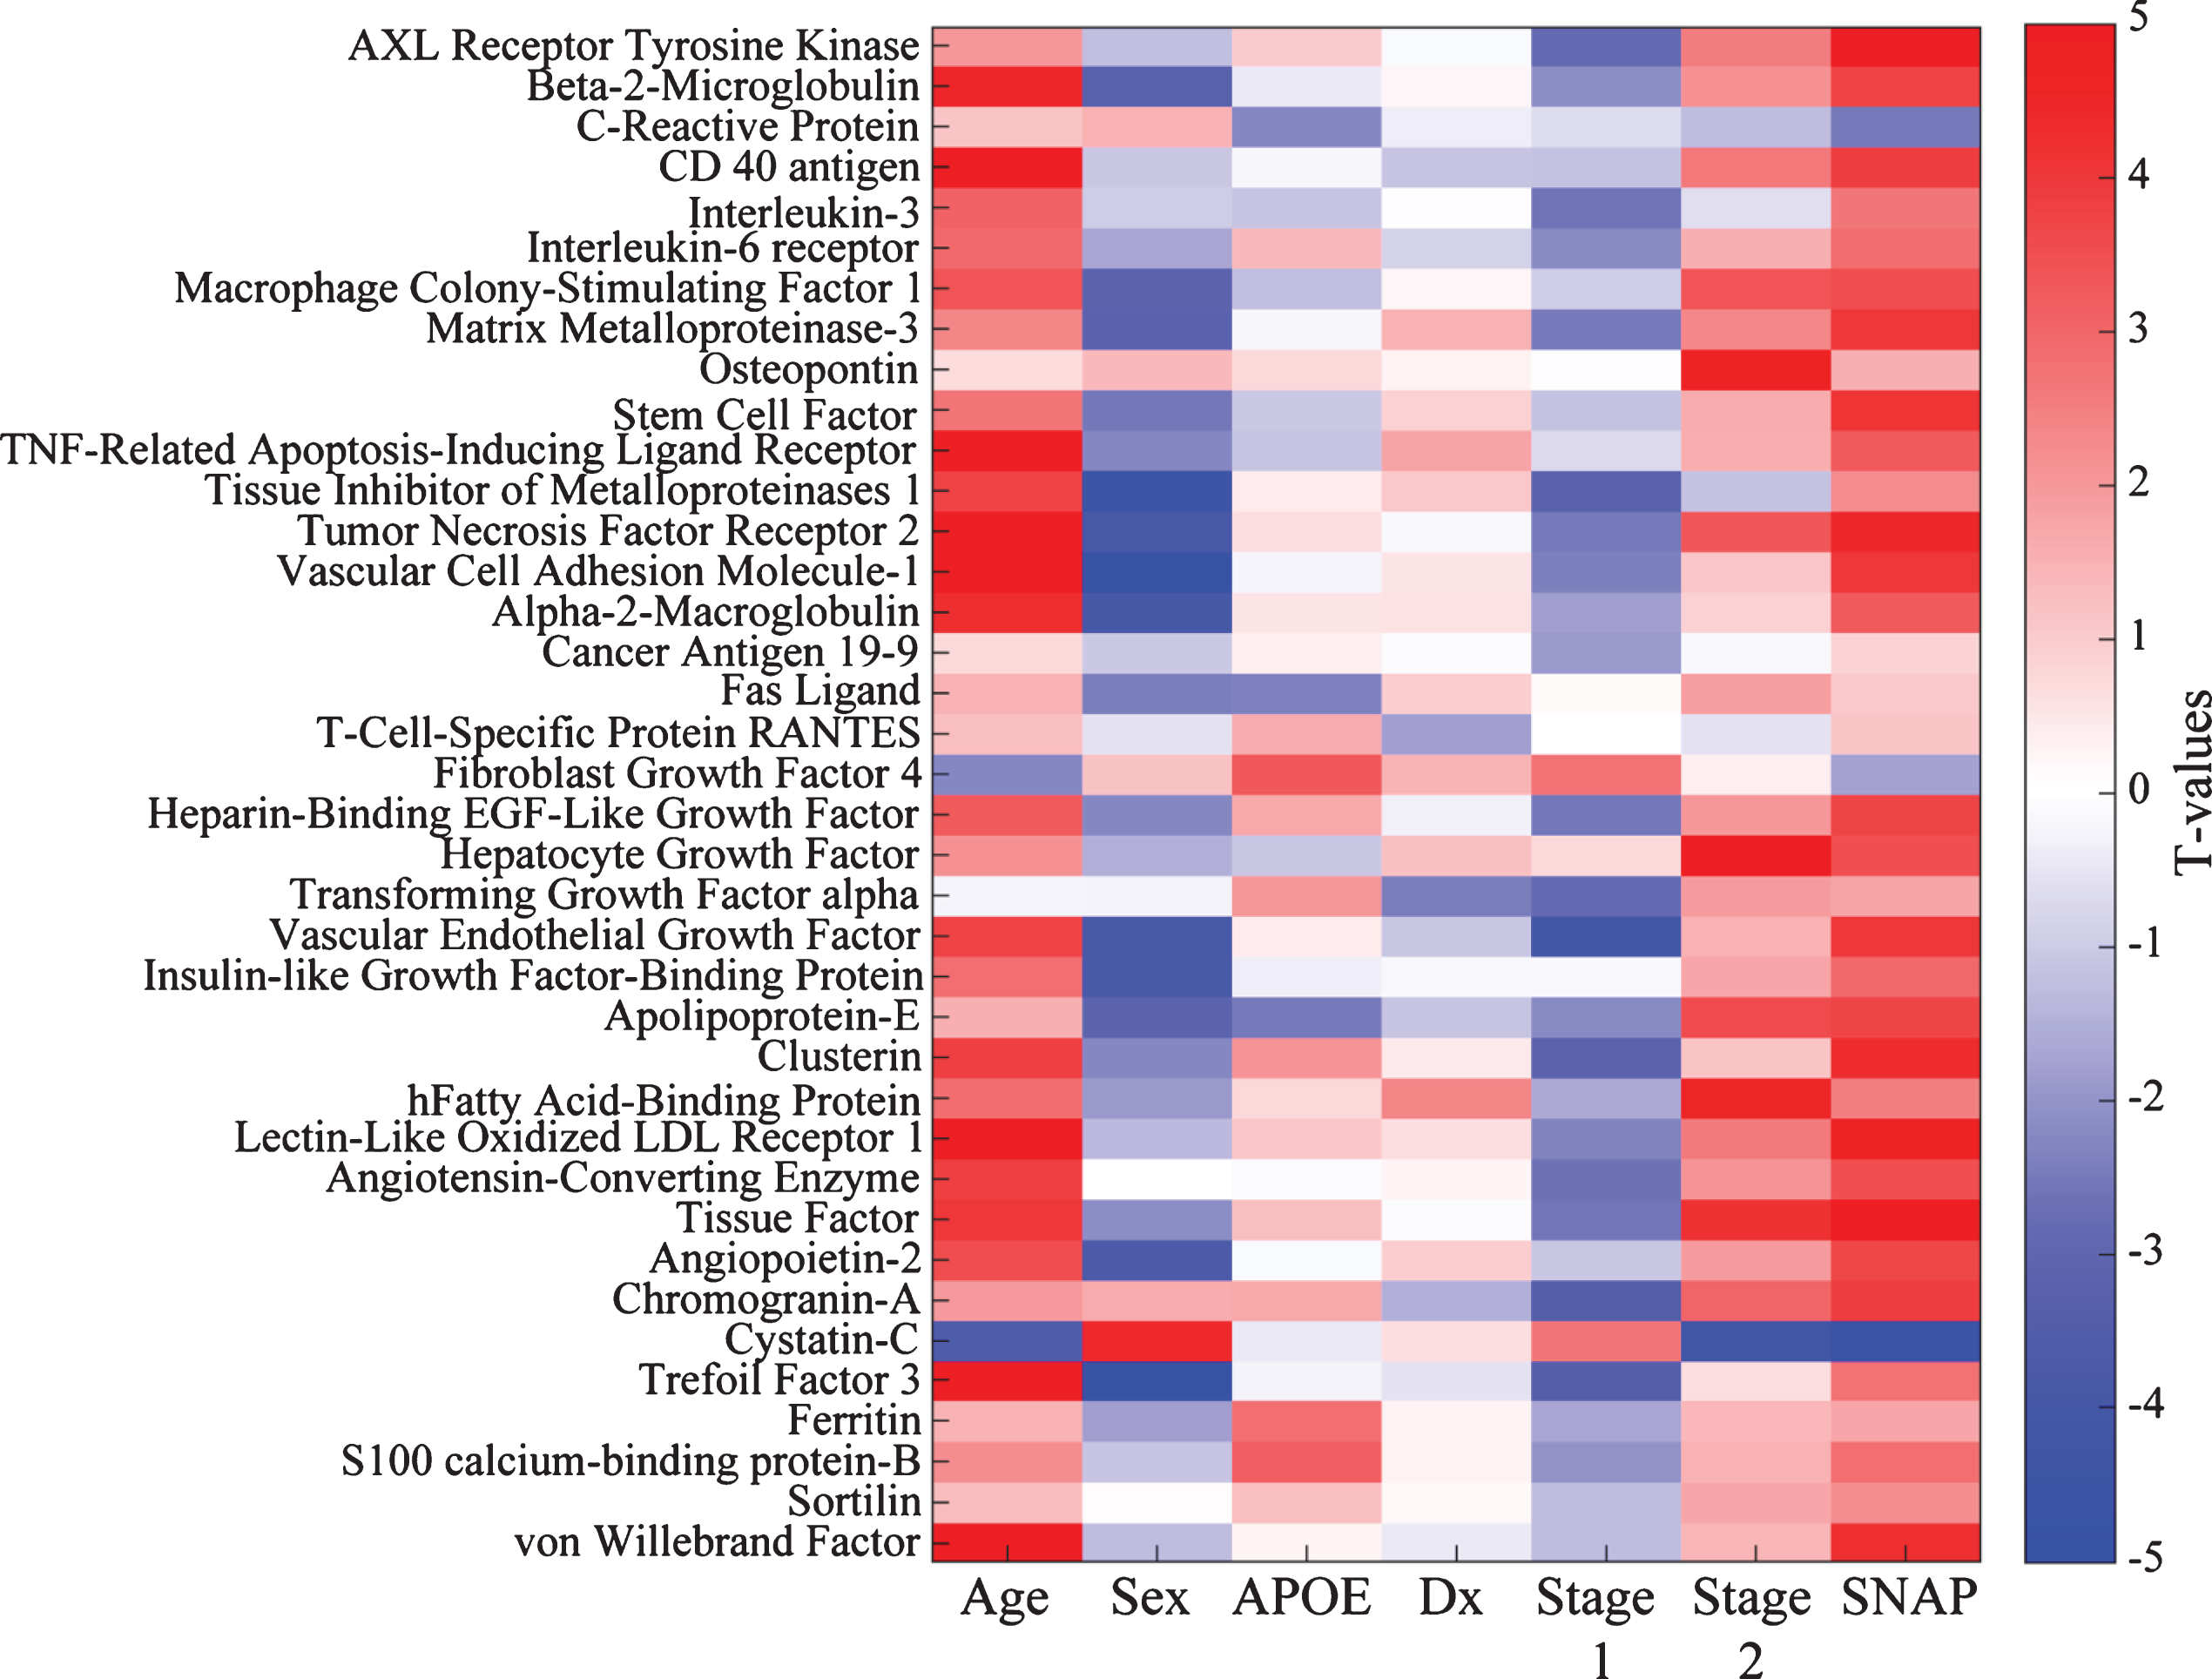
Only three markers (apoE, VCAM-1, and vascular endothelial growth factor [VEGF]) were common to analyses of the PREVENT-AD and ADNI samples. In both groups, VCAM-1 and apoE correlated well with t-tau/Aβ1-42 ratio (Fig. 3) and showed similar patterns of association with pathological stages, although results were less robust in PREVENT-AD. These associations failed to generalize for VEGF (Supplementary Tables 1 and 3). APOE carrier status and clinical diagnostic group did not contribute in our models, as illustrated in Table 3 and Fig. 2.
Fig.3
Markers common to both cohorts show similar association with AD pathology. Adjusted response plots show the association of apolipoprotein E level, VEGF and VCAM-1 with t-tau/Aβ1-42 ratio. R2 values are given for the fully adjusted model, and p-values are reported for the given CSF marker in this model.
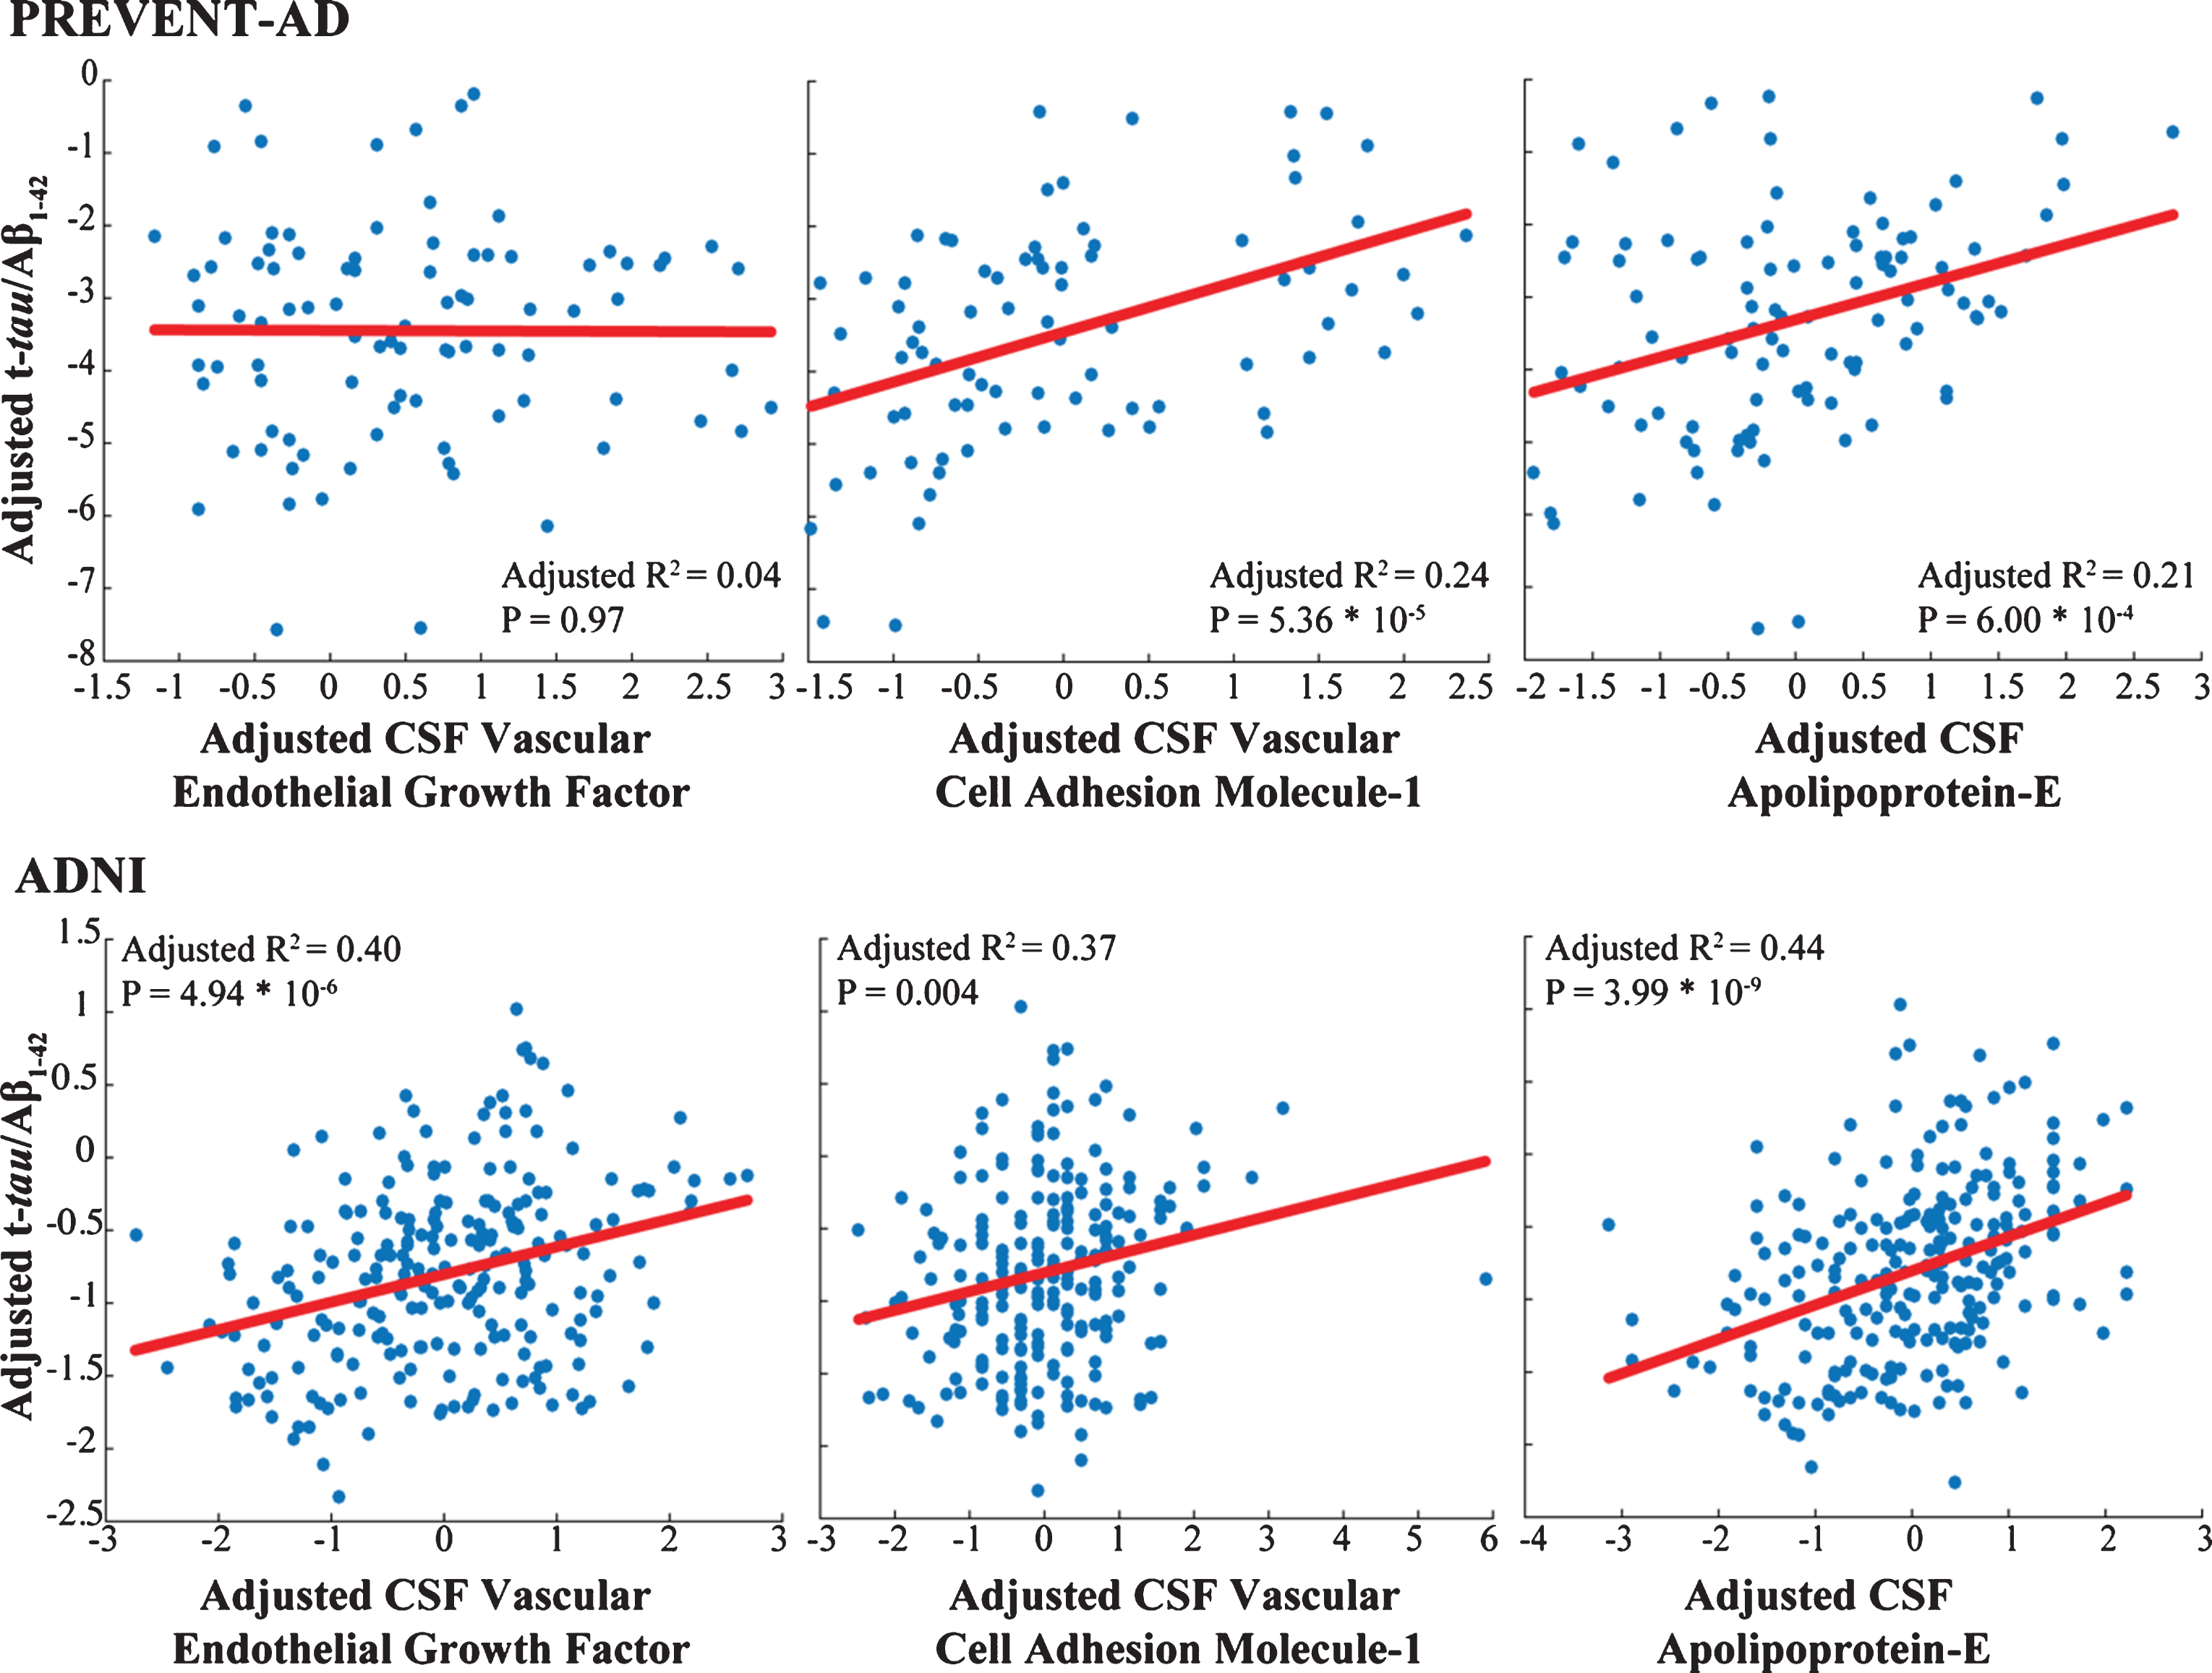
Table 3
Coefficients of fully adjusted linear regression models evaluating the association of CSF markers with pathological stage
| Age (y) | Gender | APOE ɛ4 carrier status | Clinical Diagnostic Group | Pathological Stage | |
| PREVENT-AD | |||||
| apoE | β: 0.00 p: 0.29 | β: 0.08 p: 0.71 | β: –0.08 p: 0.74 | β: 0.32 p: 0.002 | |
| VCAM-1 | β: 0.00 p: 0.20 | β: 0.15 p: 0.58 | β: –0.28 p: 0.29 | β: 0.40 p: 0.002 | |
| VEGF | β: 0.00 p: 0.23 | β: –0.27 p: 0.29 | β: –0.16 p: 0.56 | β: 0.03 p: 0.77 | |
| ADNI | |||||
| apoE | β: 0.01 p: 0.22 | β: –0.39 p: 0.002 | β: –0.47 p: 0.0006 | β: –0.22 p: 0.10 | β: 0.38 p: 5.38E-7 |
| VCAM-1 | β: 0.04 p: 5.37E-6 | β: –0.68 p: 7.08E-8 | β: –0.20 p: 0.12 | β: –0.06 p: 0.63 | β: 0.24 p: 7.19E-4 |
| VEGF | β: 0.03 p: 1.39E-3 | β: –0.47 p: 3.26E-4 | β: –0.16 p: 0.24 | β: –0.28 p: 0.04 | β: 0.29 p: 1.54E-4 |
DISCUSSION
Immune processes are important in the pathogenesis of AD [4]. For example, activated microglia and astrocytes co-localize with amyloid plaques in the brains of AD animal models and individuals with dementia [6].
In the high-risk but cognitively unimpaired PREVENT-AD cohort, we observed a distinct bi-directional relationship between six immune marker levels and pathological stage, an approximate indicator of disease progression. This non-linear pattern appeared despite a direct overall correlation between four of these markers with t-tau/Aβ1-42 ratio. In a corroborative analysis of the ADNI-1 participants (90 HCs and 147 with MCI) having CSF measurements for 83 proteins, we identified a similar pattern of change with advancing AD pathology. As described previously by others [12–15], CSF immune marker levels increased overall with advancing AD pathology in both cohorts. However, an important refinement of this trend suggested that such marker levels increased strongly only after appearance of tau abnormality. Indeed, a number of CSF proteins, including immune markers, appeared to decrease with decline in Aβ1-42 (i.e., with increasing plaque burden).
PREVENT-AD: Increased CSF immune activity with advancing AD pathology
Studies in the PREVENT-AD cohort are of particular interest because they focus on changes in the pre-symptomatic or very early-symptomatic evolution of AD pathology. This characteristic of the sample enabled us to examine closely the stages of transition between absence of AD-related changes through early evidence of tau pathology. In findings similar to those of others [20], increases in the t-tau/Aβ1-42 ratio were accompanied by higher concentrations of IL-15, MCP-1, ICAM-1, and VCAM-1. Observations in this cohort that immune markers tended to increase only after the appearance of tau abnormality are consistent also with recent observations in autosomal dominant AD [12]. Furthermore, the pattern is reminiscent of that observed for YKL-40 in pre-clinical “sporadic” AD [14].
ADNI: Bi-directional pattern of association between CSF proteins and pathological stage
Studies in the ADNI sample provided complementary evidence to PREVENT-AD. While ADNI included healthy individuals, these were on average a decade older. In addition, ADNI considered individuals with more severe cognitive symptoms who were accordingly more likely to have advanced pathology. This feature provided a notable opportunity to verify the bi-directional pattern observed in PREVENT-AD. Some 25% of the markers analyzed showed the expected pattern. Interestingly, again most of these proteins also showed a correlation with the t-tau/Aβ1-42 ratio.
These results suggest that, independent of clinical diagnosis, there exists a moderate early decrease in CSF immune markers that is not captured by t-tau/Aβ1-42 ratio. This pattern appears primarily related to decreasing CSF Aβ1-42. Because, in both samples, CSF t-tau accounts for more variance in the ratio than does Aβ1-42, this effect may ordinarily be hidden by the stronger—opposite–association with tau.
Nature of markers showing the bi-directional pattern
PREVENT-AD markers that exhibit a bi-directional pattern of association with stage are readily recognized as markers of neuro-immune processes. The IL-12/23 signaling pathway is thought to be important in AD, as its regulation may mitigate pathological and cognitive expression of disease in mice [33]. Both IL-12 and IL-23 promote immune responses by stimulating T-cells [34]. IL-12 does so by inducing production of interferon-γ while IL-23 favors the production of IL-17 [35]. It is unclear, however, whether IL-12 levels are elevated in AD [36–38]. IL-8 plays an important role in the chemotaxis of neutrophils [39, 40] which have been recently identified as possible actors in the immune response to AD pathology [41]. IL-8 is a useful marker of intrathecal inflammation and is produced by a variety of activated innate immune cells [42]. Again, however, it is unclear whether it is upregulated in AD [11, 43]. IL-15 is a general stimulator of immunity as it activates natural killer, CD8, and T-cells [44, 45]. Its levels have been reported as being lower in plasma of AD patients [46] but higher in the CSF of AD vs. other, non-inflammatory neurological disorders [47].
ICAM and VCAM are cell adhesion molecules. While they play roles in the vascular system, they are also important in immune responses. For instance, endothelial cell VCAM-1 expression is induced by cytokines, promoting adhesion of lymphocytes [48]. In inflammatory reactions, production of VCAM-1 by endothelial cells was initially believed to limit inflammation [49]. Recent work however, suggests that this peptide may play an active role in blood-brain barrier (BBB) disruption [50]. In the immune-activated brain, VCAM is also produced by activated astrocytes [51]. ICAM-1, produced by fibroblast and endothelial cells, is potentiated by IL-1 signaling [52]. ICAM-1 is involved in leukocyte recruitment and migration through the BBB [53]. In all, therefore, these markers appear closely related to the potentiation of innate immunity through recruitment of immune cells via chemotactic signaling or BBB disruption.
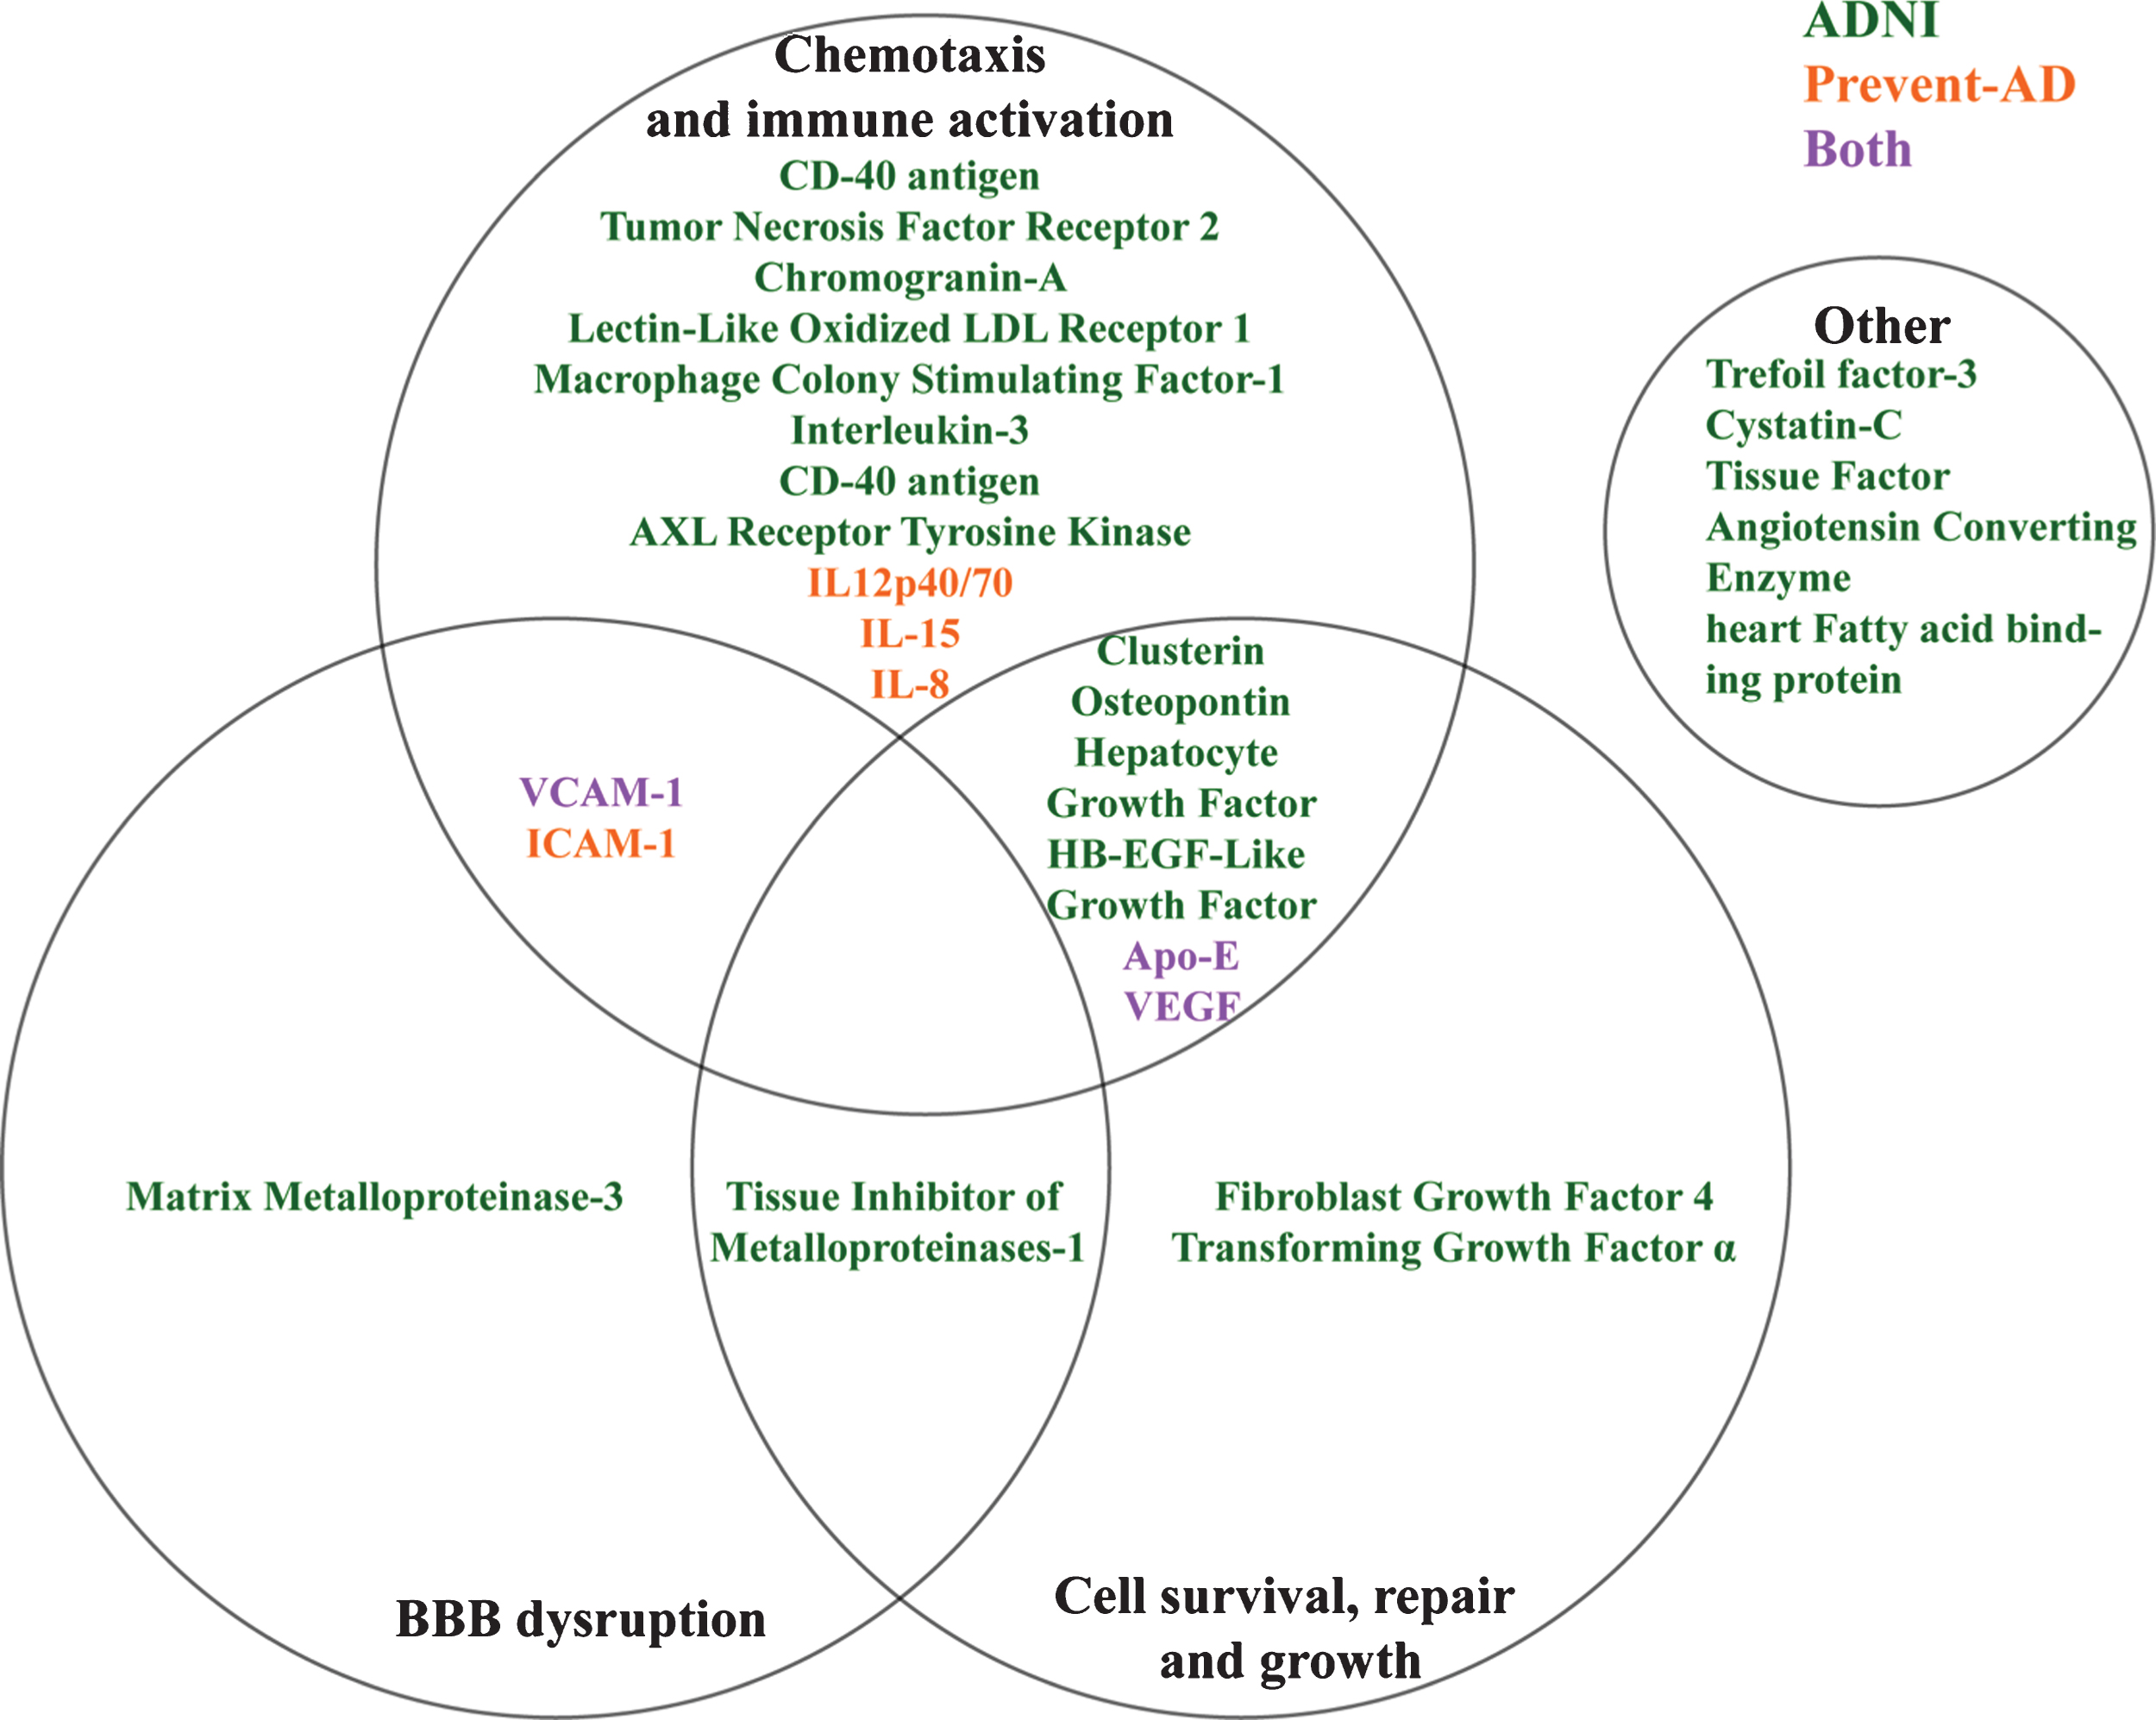
Although they are individually different, ADNI markers showing the same bi-directional relation to pathological stage appear to have overlapping mechanisms of action (Fig. 4). For instance, AXL receptor tyrosine kinase [54, 55], IL-3 [56], CD40 antigen [57], Macrophage colony stimulating factor [58], Lectin-like oxidized LDL receptor [59], and Chromogranin-A [60] among others have been implicated in activation and recruitment of immune cells in CNS inflammatory processes. Similarly, other markers such as VEGF [61], VCAM-1 and the Matrix-Metalloproteinase 3 [62] are associated with vascular function but may facilitate the entrance of immune cells into the CNS through either chemotaxis or BBB breakdown. All of this suggests that several immune and vascular changes may occur concurrently with the appearance of AD pathology, as suggested previously [3].
Fig.4
Overlapping theoretical biological pathways of identified ADNI and PREVENT-AD proteins.
It is unclear why most of these markers remain unchanged or are diminished with appearance of early amyloid pathology. Speculative explanations include a lack of inflammatory response to initial AD pathology [12, 13, 15]. However, animal work has shown that Aβ plaques are surrounded by activated microglia with associated cytokine production (reviewed by [4]). An interesting observation in both cohorts is that, despite their small numbers, participants with ‘SNAP’ have even higher immune marker levels than the Stage 2 group. This observation is relatively weak in PREVENT-AD, where it reaches statistical significance only for IL12-P70 (p = 0.001), but is stronger in ADNI where it holds for 17/23 proteins (data not shown, all p < 0.05). These findings raise the possibility that Aβ plaques initially buffer or diminish the normal brain immune response to insult. Additional studies, including longitudinal observations will be necessary to evaluate this idea.
Strengths and limitations
A clear limitation in PREVENT-AD is its small numbers of individuals at pathological Stages 1 and, especially, 2. Another caveat is that only VCAM-1 remained significantly reduced at Stage 1 or increased at Stage 2 when we included the 19 participants with AD biomarkers in the±5% “no man’s land” around inter-stage thresholds. Even so, an association with stage for the remaining four immune markers remained evident at a trend level of P < 0.1 (unadjusted). Furthermore, the differences in PREVENT-AD and ADNI assays for measurement of CSF AD and protein markers pose some difficulty for the interpretation of these results. In all, three markers assayed in both cohorts showed similar results, thereby supporting our conclusions. At the very least, therefore, studies of immune mechanisms in AD should consider stage and extent of pathological change beyond clinical diagnosis.
ACKNOWLEDGMENTS
The authors thank Dr. Nathalie Arbour, Université de Montréal, and Manon Boiteux, MSc, for advice and stimulating discussions concerning analysis and results. We further acknowledge all members of the Centre for Studies on the Prevention of Alzheimer’s Disease for their contribution to data collection. We also thank the PREVENT-AD volunteers for their extraordinary commitment to this work.
This study was funded by support from McGill University, by an unrestricted gift from Pfizer Canada, and by infrastructure support from the Canada Fund for Innovation. Dr. Breitner’s efforts are supported by a Canada Research Chair award from the government of Canada. Support for genetic and laboratory work was provided by the Fonds de Recherche du Québec-Santé (FRQ-S) and by the J.L. Levesque Foundation (J.P). Additional support was provided by the Douglas Mental Health University Institute Foundation.
Data collection and sharing for this project were funded by the Alzheimer’s Disease Neuroimaging Initiative (ADNI) (National Institutes of Health Grant U01 AG024904) and DOD ADNI (Department of Defense award number W81XWH-12-2-0012). ADNI is funded by the National Institute on Aging, the National Institute of Biomedical Imaging and Bioengineering, and through generous contributions from the following: AbbVie, Alzheimer’s Association; Alzheimer’s Drug Discovery Foundation; Araclon Biotech; BioClinica, Inc.; Biogen; Bristol-Myers Squibb Company; CereSpir, Inc.; Cogstate; Eisai Inc.; Elan Pharmaceuticals, Inc.; Eli Lilly and Company; EuroImmun; F. Hoffmann-La Roche Ltd and its affiliated company Genentech, Inc.; Fujirebio; GE Healthcare; IXICO Ltd.; Janssen Alzheimer Immunotherapy Research & Development, LLC.; Johnson & Johnson Pharmaceutical Research & Development LLC.; Lumosity; Lundbeck; Merck & Co., Inc.; Meso Scale Diagnostics, LLC.; NeuroRx Research; Neurotrack Technologies; Novartis Pharmaceuticals Corporation; Pfizer Inc.; Piramal Imaging; Servier; Takeda Pharmaceutical Company; and Transition Therapeutics. The Canadian Institutes for Health Research provide funds to support ADNI clinical sites in Canada. Private sector contributions are facilitated by the Foundation for the National Institutes of Health (http://www.fnih.org). The grantee organization is the Northern California Institute for Research and Education, and the study is coordinated by the Alzheimer’s Therapeutic Research Institute at the University of Southern California. ADNI data are disseminated by the Laboratory of Neuro Imaging at the University of Southern California.
Authors’ disclosures available online (https://www.j-alz.com/manuscript-disclosures/17-0887r2).
SUPPLEMENTARY MATERIAL
[1] The supplementary material is available in the electronic version of this article: http://dx.doi.org/10.3233/JAD-170887.
REFERENCES
[1] | Jack CR Jr , Knopman DS , Jagust WJ , Shaw LM , Aisen PS , Weiner MW , Petersen RC , Trojanowski JQ ((2010) ) Hypothetical model of dynamic biomarkers of the Alzheimer’s pathological cascade. Lancet Neurol 9: , 119–128. |
[2] | Iturria-Medina Y , Sotero RC , Toussaint PJ , Mateos-Perez JM , Evans AC , Alzheimer’s Disease Neuroimaging Initiative ((2016) ) Early role of vascular dysregulation on late-onset Alzheimer’s disease based on multifactorial data-driven analysis. Nat Commun 7: , 11934. |
[3] | Zlokovic BV ((2011) ) Neurovascular pathways to neurodegeneration in Alzheimer’s disease and other disorders. Nat Rev Neurosci 12: , 723–738. |
[4] | Heneka MT , Carson MJ , El Khoury J , Landreth GE , Brosseron F , Feinstein DL , Jacobs AH , Wyss-Coray T , Vitorica J , Ransohoff RM , Herrup K , Frautschy SA , Finsen B , Brown GC , Verkhratsky A , Yamanaka K , Koistinaho J , Latz E , Halle A , Petzold GC , Town T , Morgan D , Shinohara ML , Perry VH , Holmes C , Bazan NG , Brooks DJ , Hunot S , Joseph B , Deigendesch N , Garaschuk O , Boddeke E , Dinarello CA , Breitner JC , Cole GM , Golenbock DT , Kummer MP ((2015) ) Neuroinflammation in Alzheimer’s disease. Lancet Neurol 14: , 388–405. |
[5] | McGeer PL , McGeer E , Rogers J , Sibley J ((1990) ) Anti-inflammatory drugs and Alzheimer disease. Lancet 335: , 1037. |
[6] | McGeer PL , Akiyama H , Itagaki S , McGeer EG ((1989) ) Immune system response in Alzheimer’s disease. Can J Neurol Sci 16: , 516–527. |
[7] | Jonsson T , Stefansson H , Steinberg S , Jonsdottir I , Jonsson PV , Snaedal J , Bjornsson S , Huttenlocher J , Levey AI , Lah JJ , Rujescu D , Hampel H , Giegling I , Andreassen OA , Engedal K , Ulstein I , Djurovic S , Ibrahim-Verbaas C , Hofman A , Ikram MA , van Duijn CM , Thorsteinsdottir U , Kong A , Stefansson K ((2013) ) Variant of TREM2 associated with the risk of Alzheimer’s disease. N Engl J Med 368: , 107–116. |
[8] | Guerreiro R , Wojtas A , Bras J , Carrasquillo M , Rogaeva E , Majounie E , Cruchaga C , Sassi C , Kauwe JS , Younkin S , Hazrati L , Collinge J , Pocock J , Lashley T , Williams J , Lambert JC , Amouyel P , Goate A , Rademakers R , Morgan K , Powell J , St George-Hyslop P , Singleton A , Hardy J , Alzheimer Genetic Analysis Group ((2013) ) TREM2 variants in Alzheimer’s disease. N Engl J Med 368: , 117–127. |
[9] | Zhang B , Gaiteri C , Bodea LG , Wang Z , McElwee J , Podtelezhnikov AA , Zhang C , Xie T , Tran L , Dobrin R , Fluder E , Clurman B , Melquist S , Narayanan M , Suver C , Shah H , Mahajan M , Gillis T , Mysore J , MacDonald ME , Lamb JR , Bennett DA , Molony C , Stone DJ , Gudnason V , Myers AJ , Schadt EE , Neumann H , Zhu J , Emilsson V ((2013) ) Integrated systems approach identifies genetic nodes and networks in late-onset Alzheimer’s disease. Cell 153: , 707–720. |
[10] | Hollingworth P , Harold D , Sims R , Gerrish A , Lambert JC , Carrasquillo MM , Abraham R , Hamshere ML , Pahwa JS , Moskvina V , Dowzell K , Jones N , Stretton A , Thomas C , Richards A , Ivanov D , Widdowson C , Chapman J , Lovestone S , Powell J , Proitsi P , Lupton MK , Brayne C , Rubinsztein DC , Gill M , Lawlor B , Lynch A , Brown KS , Passmore PA , Craig D , McGuinness B , Todd S , Holmes C , Mann D , Smith AD , Beaumont H , Warden D , Wilcock G , Love S , Kehoe PG , Hooper NM , Vardy ER , Hardy J , Mead S , Fox NC , Rossor M , Collinge J , Maier W , Jessen F , Rüther E , Schürmann B , Heun R , Kölsch H , van den Bussche H , Heuser I , Kornhuber J , Wiltfang J , Dichgans M , Frölich L , Hampel H , Gallacher J , Hüll M , Rujescu D , Giegling I , Goate AM , Kauwe JS , Cruchaga C , Nowotny P , Morris JC , Mayo K , Sleegers K , Bettens K , Engelborghs S , De Deyn PP , Van Broeckhoven C , Livingston G , Bass NJ , Gurling H , McQuillin A , Gwilliam R , Deloukas P , Al-Chalabi A , Shaw CE , Tsolaki M , Singleton AB , Guerreiro R , Mühleisen TW , Nöthen MM , Moebus S , Jöckel KH , Klopp N , Wichmann HE , Pankratz VS , Sando SB , Aasly JO , Barcikowska M , Wszolek ZK , Dickson DW , Graff-Radford NR , Petersen RC ; Alzheimer’s Disease Neuroimaging Initiative, van Duijn CM , Breteler MM , Ikram MA , DeStefano AL , Fitzpatrick AL , Lopez O , Launer LJ , Seshadri S ; CHARGE consortium, Berr C , Campion D , Epelbaum J , Dartigues JF , Tzourio C , Alpérovitch A , Lathrop M ; EADI1 consortium, Feulner TM , Friedrich P , Riehle C , Krawczak M , Schreiber S , Mayhaus M , Nicolhaus S , Wagenpfeil S , Steinberg S , Stefansson H , Stefansson K , Snaedal J , Björnsson S , Jonsson PV , Chouraki V , Genier-Boley B , Hiltunen M , Soininen H , Combarros O , Zelenika D , Delepine M , Bullido MJ , Pasquier F , Mateo I , Frank-Garcia A , Porcellini E , Hanon O , Coto E , Alvarez V , Bosco P , Siciliano G , Mancuso M , Panza F , Solfrizzi V , Nacmias B , Sorbi S , Bossù P , Piccardi P , Arosio B , Annoni G , Seripa D , Pilotto A , Scarpini E , Galimberti D , Brice A , Hannequin D , Licastro F , Jones L , Holmans PA , Jonsson T , Riemenschneider M , Morgan K , Younkin SG , Owen MJ , O’Donovan M , Amouyel P , Williams J ((2011) ) Common variants at ABCA7, MS4A6A/MS4A4E, EPHA1, CD33 and CD2AP are associated with Alzheimer’s disease. Nat Genet 43: , 429–435. |
[11] | Brosseron F , Krauthausen M , Kummer M , Heneka MT ((2014) ) Body fluid cytokine levels in mild cognitive impairment and Alzheimer’s disease: A comparative overview. Mol Neurobiol 50: , 534–544. |
[12] | Suarez-Calvet M , Araque Caballero MA , Kleinberger G , Bateman RJ , Fagan AM , Morris JC , Levin J , Danek A , Ewers M , Haass C , Dominantly Inherited Alzheimer Network ((2016) ) Early changes in CSF sTREM2 in dominantly inherited Alzheimer’s disease occur after amyloid deposition and neuronal injury. Sci Transl Med 8: , 369ra178. |
[13] | Henjum K , Almdahl IS , Arskog V , Minthon L , Hansson O , Fladby T , Nilsson LN ((2016) ) Cerebrospinal fluid soluble TREM2 in aging and Alzheimer’s disease. Alzheimers Res Ther 8: , 17. |
[14] | Alcolea D , Martínez-Lage P , Sánchez-Juan P , Olazarán J , Antúnez C , Izagirre A , Ecay-Torres M , Estanga A , Clerigué M , Guisasola MC , Sánchez Ruiz D , Marín Muñoz J , Calero M , Blesa R , Clarimón J , Carmona-Iragui M , Morenas-Rodríguez E , Rodríguez-Rodríguez E , Vázquez Higuera JL , Fortea J , Lleó A ((2015) ) Amyloid precursor protein metabolism and inflammation markers in preclinical Alzheimer disease. Neurology 85: , 626–633. |
[15] | Bonham LW , Desikan RS , Yokoyama JS , Alzheimer’s Disease Neuroimaging Initiative ((2016) ) The relationship between complement factor C3, APOE epsilon4, amyloid and tau in Alzheimer’s disease. Acta Neuropathol Commun 4: , 65. |
[16] | Sperling RA , Aisen PS , Beckett LA , Bennett DA , Craft S , Fagan AM , Iwatsubo T , Jack CR Jr , Kaye J , Montine TJ , Park DC , Reiman EM , Rowe CC , Siemers E , Stern Y , Yaffe K , Carrillo MC , Thies B , Morrison-Bogorad M , Wagster MV , Phelps CH ((2011) ) Toward defining the preclinical stages of Alzheimer’s disease: Recommendations from the National Institute on Aging-Alzheimer’s Association workgroups on diagnostic guidelines for Alzheimer’s disease. Alzheimers Dement 7: , 280–292. |
[17] | Jack CR Jr , Knopman DS , Weigand SD , Wiste HJ , Vemuri P , Lowe V , Kantarci K , Gunter JL , Senjem ML , Ivnik RJ , Roberts RO , Rocca WA , Boeve BF , Petersen RC ((2012) ) An operational approach to National Institute on Aging-Alzheimer’s Association criteria for preclinical Alzheimer disease. Ann Neurol 71: , 765–775. |
[18] | Breitner JCS , Poirier J , Etienne PE , Leoutsakos JM , PREVENT-AD Research Group ((2016) ) Rationale and Structure for a New Center for Studies on Prevention of Alzheimer’s Disease (StoP-AD). J Prev Alzheimer Dis 3: , 236–242. |
[19] | Nasreddine ZS , Phillips NA , Bedirian V , Charbonneau S , Whitehead V , Collin I , Cummings JL , Chertkow H ((2005) ) The Montreal Cognitive Assessment, MoCA: A brief screening tool for mild cognitive impairment. J Am Geriatr Soc 53: , 695–699. |
[20] | Popp J , Oikonomidi A , Tautvydaite D , Dayon L , Bacher M , Migliavacca E , Henry H , Kirkland R , Severin I , Wojcik J , Bowman GL ((2017) ) Markers of neuroinflammation associated with Alzheimer’s disease pathology in older adults. Brain Behav Immun 62: , 203–211. |
[21] | Tukey JW ((1970) ), Exploratory Data Analysis, Addison-Wesley. |
[22] | Mattsson N , Insel PS , Donohue M , Jagust W , Sperling R , Aisen P , Weiner MW , Alzheimer’s Disease Neuroimaging Initiative ((2015) ) Predicting reduction of cerebrospinal fluid beta-amyloid 42 in cognitively healthy controls. JAMA Neurol 72: , 554–560. |
[23] | Tijms BM , Bertens D , Slot RE , Gouw AA , Teunissen CE , Scheltens P , van der Flier WM , Visser PJ ((2017) ) Low normal cerebrospinal fluid Abeta42 levels predict clinical progression in nondemented subjects. Ann Neurol 81: , 749–753. |
[24] | Farrell ME , Kennedy KM , Rodrigue KM , Wig G , Bischof GN , Rieck JR , Chen X , Festini SB , Devous MD Sr. , Park DC ((2017) ) Association of longitudinal cognitive decline with amyloid burden in middle-aged and older adults: Evidence for a dose-response relationship. JAMA Neurol 74: , 830–838. |
[25] | Donohue MC , Sperling RA , Petersen R , Sun CK , Weiner MW , Aisen PS , Alzheimer’s Disease Neuroimaging Initiative ((2017) ) Association between elevated brain amyloid and subsequent cognitive decline among cognitively normal persons. JAMA 317: , 2305–2316. |
[26] | Shaw LM , Vanderstichele H , Knapik-Czajka M , Clark CM , Aisen PS , Petersen RC , Blennow K , Soares H , Simon A , Lewczuk P , Dean R , Siemers E , Potter W , Lee VMY , Trojanowski JQ ((2009) ) Cerebrospinal fluid biomarker signature in Alzheimer’s disease neuroimaging initiative subjects. Ann Neurol 65: , 403–413. |
[27] | Saykin AJ , Shen L , Foroud TM , Potkin SG , Swaminathan S , Kim S , Risacher SL , Nho K , Huentelman MJ , Craig DW , Thompson PM , Stein JL , Moore JH , Farrer LA , Green RC , Bertram L , Jack CR Jr , Weiner MW , Alzheimer’s Disease Neuroimaging Initiative ((2010) ) Alzheimer’s Disease Neuroimaging Initiative biomarkers as quantitative phenotypes: Genetics core aims, progress, and plans. Alzheimers Dement 6: , 265–273. |
[28] | Benjamini Y , Hochberg Y ((1995) ) Controlling the false discovery rate: A practical and powerful approach to multiple testing. J R Stat Soc Series B Stat Methodol 57: , 289–300. |
[29] | McGeachie MJ , Chang HH , Weiss ST ((2014) ) CGBayesNets: Conditional Gaussian Bayesian network learning and inference with mixed discrete and continuous data. PLoS Comput Biol 10: , e1003676. |
[30] | Kass RE , Raftery AE ((1995) ) Bayes factors. J Am Stat Assoc 90: , 773–795. |
[31] | Mattsson N , Insel PS , Donohue M , Landau S , Jagust WJ , Shaw LM , Trojanowski JQ , Zetterberg H , Blennow K , Weiner MW , Alzheimer’s Disease Neuroimaging Initiative ((2015) ) Independent information from cerebrospinal fluid amyloid-beta and florbetapir imaging in Alzheimer’s disease. Brain 138: , 772–783. |
[32] | Fagan AM , Mintun MA , Mach RH , Lee SY , Dence CS , Shah AR , LaRossa GN , Spinner ML , Klunk WE , Mathis CA , DeKosky ST , Morris JC , Holtzman DM ((2006) ) Inverse relation between in vivo amyloid imaging load and cerebrospinal fluid Abeta42 in humans. Ann Neurol 59: , 512–519. |
[33] | Vom Berg J , Prokop S , Miller KR , Obst J , Kalin RE , Lopategui-Cabezas I , Wegner A , Mair F , Schipke CG , Peters O , Winter Y , Becher B , Heppner FL ((2012) ) Inhibition of IL-12/IL-23 signaling reduces Alzheimer’s disease-like pathology and cognitive decline. Nat Med 18: , 1812–1819. |
[34] | Watford WT , Hissong BD , Bream JH , Kanno Y , Muul L , O’Shea JJ ((2004) ) Signaling by IL-12 and IL-23 and the immunoregulatory roles of STAT4. Immunol Rev 202: , 139–156. |
[35] | Aggarwal S , Ghilardi N , Xie MH , de Sauvage FJ , Gurney AL ((2003) ) Interleukin-23 promotes a distinct CD4 T cell activation state characterized by the production of interleukin-17. J Biol Chem 278: , 1910–1914. |
[36] | Rota E , Bellone G , Rocca P , Bergamasco B , Emanuelli G , Ferrero P ((2006) ) Increased intrathecal TGF-β1, but not IL-12, IFN-γ and IL-10 levels in Alzheimer’s disease patients. Neurol Sci 27: , 33–39. |
[37] | Rentzos M , Paraskevas GP , Kapaki E , Nikolaou C , Zoga M , Rombos A , Tsoutsou A , Vassilopoulos DD ((2006) ) Interleukin-12 is reduced in cerebrospinal fluid of patients with Alzheimer’s disease and frontotemporal dementia. J Neurol Sci 249: , 110–114. |
[38] | Johansson P , Almqvist EG , Wallin A , Johansson JO , Andreasson U , Blennow K , Zetterberg H , Svensson J ((2017) ) Reduced cerebrospinal fluid concentration of interleukin-12/23 subunit p40 in patients with cognitive impairment. PLoS One 12: , e0176760. |
[39] | Matsushima K , Morishita K , Yoshimura T , Lavu S , Kobayashi Y , Lew W , Appella E , Kung HF , Leonard EJ , Oppenheim JJ ((1988) ) Molecular cloning of a human monocyte-derived neutrophil chemotactic factor (MDNCF) and the induction of MDNCF mRNA by interleukin 1 and tumor necrosis factor. J Exp Med 167: , 1883–1893. |
[40] | Baggiolini M , Walz A , Kunkel SL ((1989) ) Neutrophil-activating peptide-1/interleukin 8, a novel cytokine that activates neutrophils. J Clin Invest 84: , 1045–1049. |
[41] | Zenaro E , Pietronigro E , Della Bianca V , Piacentino G , Marongiu L , Budui S , Turano E , Rossi B , Angiari S , Dusi S , Montresor A , Carlucci T , Nani S , Tosadori G , Calciano L , Catalucci D , Berton G , Bonetti B , Constantin G ((2015) ) Neutrophils promote Alzheimer’s disease-like pathology and cognitive decline via LFA-1 integrin. Nat Med 21: , 880–886. |
[42] | Komori M , Blake A , Greenwood M , Lin YC , Kosa P , Ghazali D , Winokur P , Natrajan M , Wuest SC , Romm E , Panackal AA , Williamson PR , Wu T , Bielekova B ((2015) ) Cerebrospinal fluid markers reveal intrathecal inflammation in progressive multiple sclerosis. Ann Neurol 78: , 3–20. |
[43] | Hesse R , Wahler A , Gummert P , Kirschmer S , Otto M , Tumani H , Lewerenz J , Schnack C , von Arnim CA ((2016) ) Decreased IL-8 levels in CSF and serum of AD patients and negative correlation of MMSE and IL-1beta. BMC Neurol 16: , 185. |
[44] | Carson WE , Giri JG , Lindemann MJ , Linett ML , Ahdieh M , Paxton R , Anderson D , Eisenmann J , Grabstein K , Caligiuri MA ((1994) ) Interleukin (IL) 15 is a novel cytokine that activates human natural killer cells via components of the IL-2 receptor. J Exp Med 180: , 1395–1403. |
[45] | McInnes IB , Al-Mughales J , Field M , Leung BP , Huang FP , Dixon R , Sturrock RD , Wilkinson PC , Liew FY ((1996) ) The role of interleukin-15 in T-cell migration and activation in rheumatoid arthritis. Nat Med 2: , 175–182. |
[46] | Rentzos M , Paraskevas GP , Kapaki E , Nikolaou C , Zoga M , Tsoutsou A , Rombos A , Vassilopoulos D ((2007) ) Circulating interleukin-15 in dementia disorders. J Neuropsychiatry Clin Neurosci 19: , 318–325. |
[47] | Rentzos M , Zoga M , Paraskevas GP , Kapaki E , Rombos A , Nikolaou C , Tsoutsou A , Vassilopoulos D ((2006) ) IL-15 is elevated in cerebrospinal fluid of patients with Alzheimer’s disease and frontotemporal dementia. J Geriatr Psychiatry Neurol 19: , 114–117. |
[48] | Osborn L , Hession C , Tizard R , Vassallo C , Luhowskyj S , Chi-Rosso G , Lobb R ((1989) ) Direct expression cloning of vascular cell adhesion molecule 1, a cytokine-induced endothelial protein that binds to lymphocytes. Cell 59: , 1203–1211. |
[49] | Kallmann BA , Hummel V , Lindenlaub T , Ruprecht K , Toyka KV , Rieckmann P ((2000) ) Cytokine-induced modulation of cellular adhesion to human cerebral endothelial cells is mediated by soluble vascular cell adhesion molecule-1. Brain 123: (Pt 4), 687–697. |
[50] | Haarmann A , Nowak E , Deiss A , van der Pol S , Monoranu CM , Kooij G , Muller N , van der Valk P , Stoll G , de Vries HE , Berberich-Siebelt F , Buttmann M ((2015) ) Soluble VCAM-1 impairs human brain endothelial barrier integrity via integrin alpha-4-transduced outside-in signalling. Acta Neuropathol 129: , 639–652. |
[51] | Girvin AM , Gordon KB , Welsh CJ , Clipstone NA , Miller SD ((2002) ) Differential abilities of central nervous system resident endothelial cells and astrocytes to serve as inducible antigen-presenting cells. Blood 99: , 3692–3701. |
[52] | Rothlein R , Dustin ML , Marlin SD , Springer TA ((1986) ) A human intercellular adhesion molecule (ICAM-1) distinct from LFA-1. J Immunol 137: , 1270–1274. |
[53] | Takeshita Y , Ransohoff RM ((2012) ) Inflammatory cell trafficking across the blood-brain barrier: Chemokine regulation and in vitro models. Immunol Rev 248: , 228–239. |
[54] | Lu Q , Lemke G ((2001) ) Homeostatic regulation of the immune system by receptor tyrosine kinases of the Tyro 3 family. Science 293: , 306–311. |
[55] | Weinger JG , Brosnan CF , Loudig O , Goldberg MF , Macian F , Arnett HA , Prieto AL , Tsiperson V , Shafit-Zagardo B ((2011) ) Loss of the receptor tyrosine kinase Axl leads to enhanced inflammation in the CNS and delayed removal of myelin debris during experimental autoimmune encephalomyelitis. J Neuroinflammation 8: , 49. |
[56] | Zambrano A , Otth C , Mujica L , Concha II , Maccioni RB ((2007) ) Interleukin-3 prevents neuronal death induced by amyloid peptide. BMC Neurosci 8: , 82. |
[57] | Tan J , Town T , Paris D , Mori T , Suo Z , Crawford F , Mattson MP , Flavell RA , Mullan M ((1999) ) Microglial activation resulting from CD40-CD40L interaction after beta-amyloid stimulation. Science 286: , 2352–2355. |
[58] | Giulian D , Ingeman JE ((1988) ) Colony-stimulating factors as promoters of ameboid microglia. J Neurosci 8: , 4707–4717. |
[59] | Honjo M , Nakamura K , Yamashiro K , Kiryu J , Tanihara H , McEvoy LM , Honda Y , Butcher EC , Masaki T , Sawamura T ((2003) ) Lectin-like oxidized LDL receptor-1 is a cell-adhesion molecule involved in endotoxin-induced inflammation. Proc Natl Acad Sci U S A 100: , 1274–1279. |
[60] | Taupenot L , Ciesielski-Treska J , Ulrich G , Chasserot-Golaz S , Aunis D , Bader MF ((1996) ) Chromogranin A triggers a phenotypic transformation and the generation of nitric oxide in brain microglial cells. Neuroscience 72: , 377–389. |
[61] | Forstreuter F , Lucius R , Mentlein R ((2002) ) Vascular endothelial growth factor induces chemotaxis and proliferation of microglial cells. J Neuroimmunol 132: , 93–98. |
[62] | Gurney KJ , Estrada EY , Rosenberg GA ((2006) ) Blood-brain barrier disruption by stromelysin-1 facilitates neutrophil infiltration in neuroinflammation. Neurobiol Dis 23: , 87–96. |

